
Good Energy
for Generations
C O R P O R A T E P R E S E N T A T I O N
O C T O B E R 2 0 2 6
CORPORATE PRESENTATION | FORWARD LOOKING STATEMENTS
Forward-Looking Information
The information contained herein contains "forward-looking statements" within the meaning of applicable United States securities laws and regulations and "forward-looking information" within the meaning of applicable Canadian securities legislation. "Forward-looking information" includes, but is not limited to, statements with respect to mineral reserve and mineral resource estimates, the 2021 Arrow Deposit, Rook I Project and estimates of uranium production, grade and long-term average uranium prices, anticipated effects of completed drill results on the Rook I Project, planned work programs and development activities and budgets, Canadian Nuclear Safety Commission and other approvals, completion of further site investigations and engineering work to support basic engineering of the project and expected outcomes. Generally, but not always, forward-looking information and statements can be identified by the use of words such as "plans", "expects", "is expected", "budget", "scheduled", "estimates", "forecasts", "intends", "anticipates", or "believes" or the negative connotation thereof or variations of such words and phrases or state that certain actions, events or results "may", "could", "would", "might" or "will be taken", "occur" or "be achieved" or the negative connotation thereof. Statements relating to "mineral resources" are deemed to be forward-looking information, as they involve the implied assessment that, based on certain estimates and assumptions, the mineral resources described can be profitably produced in the future.
Forward-looking information and statements are based on the then current expectations, beliefs, assumptions, estimates and forecasts about NexGen's business and the industry and markets in which it operates. Forward-looking information and statements are made based upon numerous assumptions, including among others, that the mineral reserve and resources estimates and the key assumptions and parameters on which such estimates are based are as set out in this presentation and the technical report for the property , the results of planned exploration activities are as anticipated, the price and market supply of uranium, the cost of planned exploration activities, that financing will be available if and when needed and on reasonable terms, that third party contractors, equipment, supplies and governmental and other approvals required to conduct NexGen's planned exploration activities will be available on reasonable terms and in a timely manner and that general business and economic conditions will not change in a material adverse manner. Although the assumptions made by the Company in providing forward looking information or making forward looking statements are considered reasonable by management at the time, there can be no assurance that such assumptions will prove to be accurate in the future.
Forward-looking information and statements also involve known and unknown risks and uncertainties and other factors, which may cause actual results, performances and achievements of NexGen to differ materially from any projections of results, performances and achievements of NexGen expressed or implied by such forward-looking information or statements, including, among others, the existence of negative operating cash flow and dependence on third party financing, uncertainty of the availability of additional financing, the risk that pending assay results will not confirm previously announced preliminary results, conclusions of economic valuations, the risk that actual results of exploration activities will be different than anticipated, the cost of labour, equipment or materials will increase more than expected, that the future price of uranium will decline or otherwise not rise to an economic level, the appeal of alternate sources of energy to uranium-produced energy, that the Canadian dollar will strengthen against the U.S. dollar, that mineral resources and reserves are not as estimated, that actual costs or actual results of reclamation activities are greater than expected, that changes in project parameters and plans continue to be refined and may result in increased costs, of unexpected variations in mineral resources and reserves, grade or recovery rates or other risks generally associated with mining, unanticipated delays in obtaining governmental, regulatory or First Nations approvals, risks related to First Nations title and consultation, reliance upon key management and other personnel, deficiencies in the Company’s title to its properties, uninsurable risks, failure to manage conflicts of interest, failure to obtain or maintain required permits and licences, risks related to changes in laws, regulations, policy and public perception, as well as those factors or other risks as more fully described in NexGen’s Annual Information Form dated March 3, 2026 filed with the securities commissions of all provinces and territories of Canada and in NexGen’s 40-F filed with the United States Securities and Exchange Commission, which are available on SEDAR+ at www.sedarplus.ca and Edgar at www.sec.gov.
Although the Company has attempted to identify important factors that could cause actual results to differ materially from those contained in the forward-looking information or statements or implied by forward-looking information or statements, there may be other factors that cause results not to be as anticipated, estimated or intended. Readers are cautioned not to place undue reliance on forward-looking information or statements due to the inherent uncertainty thereof. There can be no assurance that forward-looking information and statements will prove to be accurate, as actual results and future events could differ materially from those anticipated, estimated or intended. Accordingly, readers should not place undue reliance on forward-looking statements or information. The Company undertakes no obligation to update or reissue forward-looking information as a result of new information or events except as required by applicable securities laws.
This presentation includes Mineral Reserves and Mineral Resources classification terms that comply with reporting standards in Canada and the Mineral Reserves and the Mineral Resources estimates are made in accordance with NI 43-101. NI 43-101 is a rule developed by the Canadian Securities Administrators that establishes standards for all public disclosure an issuer makes of scientific and technical information concerning mineral projects. These standards differ from the requirements of the Securities and Exchange Commission (“SEC”) set the SEC's rules that are applicable to domestic United States reporting companies. Consequently, Mineral Reserves and Mineral Resources information included in this presentation is not comparable to similar information that would generally be disclosed by domestic U.S. reporting companies subject to the reporting and disclosure requirements of the SEC Accordingly, information concerning mineral deposits set forth herein may not be comparable with information made public by companies that report in accordance with U.S. standards.
All material scientific and technical information in this presentation is derived from the Company’s independent feasibility study (the “Rook I FS Technical Report” or the “FS”) entitled “Arrow Deposit, Rook I Project, Saskatchewan, Nl 43-101 Technical Report on Feasibility Study dated March 10, 2021 filed under the Company’s profile on SEDAR+ at www.sedarplus.ca and on EDGAR at www.sec.gov. For details of the Rook I Project, including the key assumptions, parameters and methods used to estimate the Mineral Resources described in this Presentation, please refer to the Rook I FS Technical Report.
All scientific and technical information in this presentation has been reviewed and approved by Mr. Simon Allard, P.Eng, Vice President, Commercial, and Mr. Jason Craven, P.Geo., Vice President, Exploration for NexGen. Mr. Allard approved the scientific and technical information related to operational matters contained in this MD&A and Mr. Craven approved the scientific and technical information related to exploration matters. Each of Mr. Allard and Mr. Craven is a qualified person for the purposes of NI 43-101.
1

NEXGEN | POWERING WHAT’S NEXT

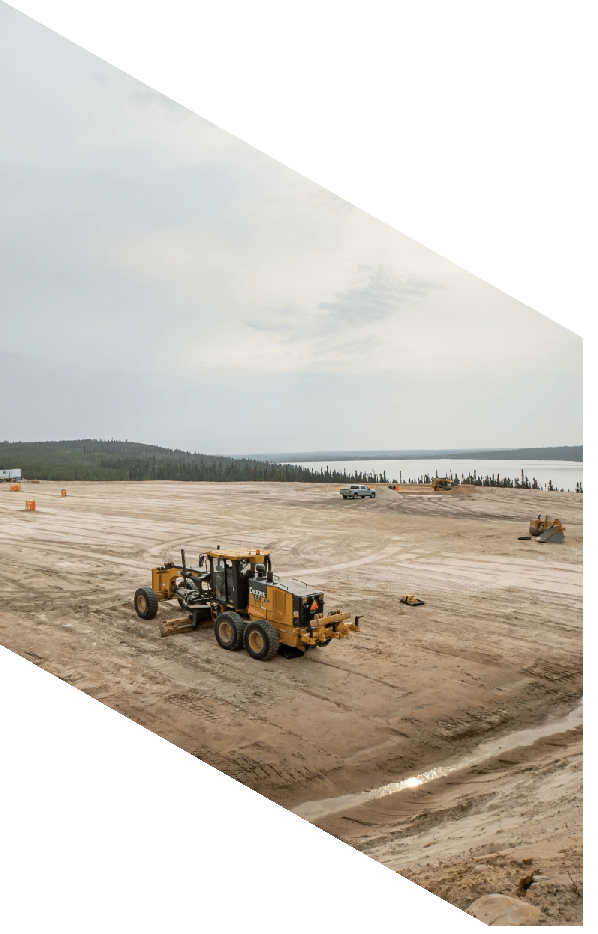
NexGen is in construction at Rook I. It is currently the largest single source of uranium in the world in construction2, with uncapped leverage, more uranium available for sale than its peers, and market prices realized on delivery.
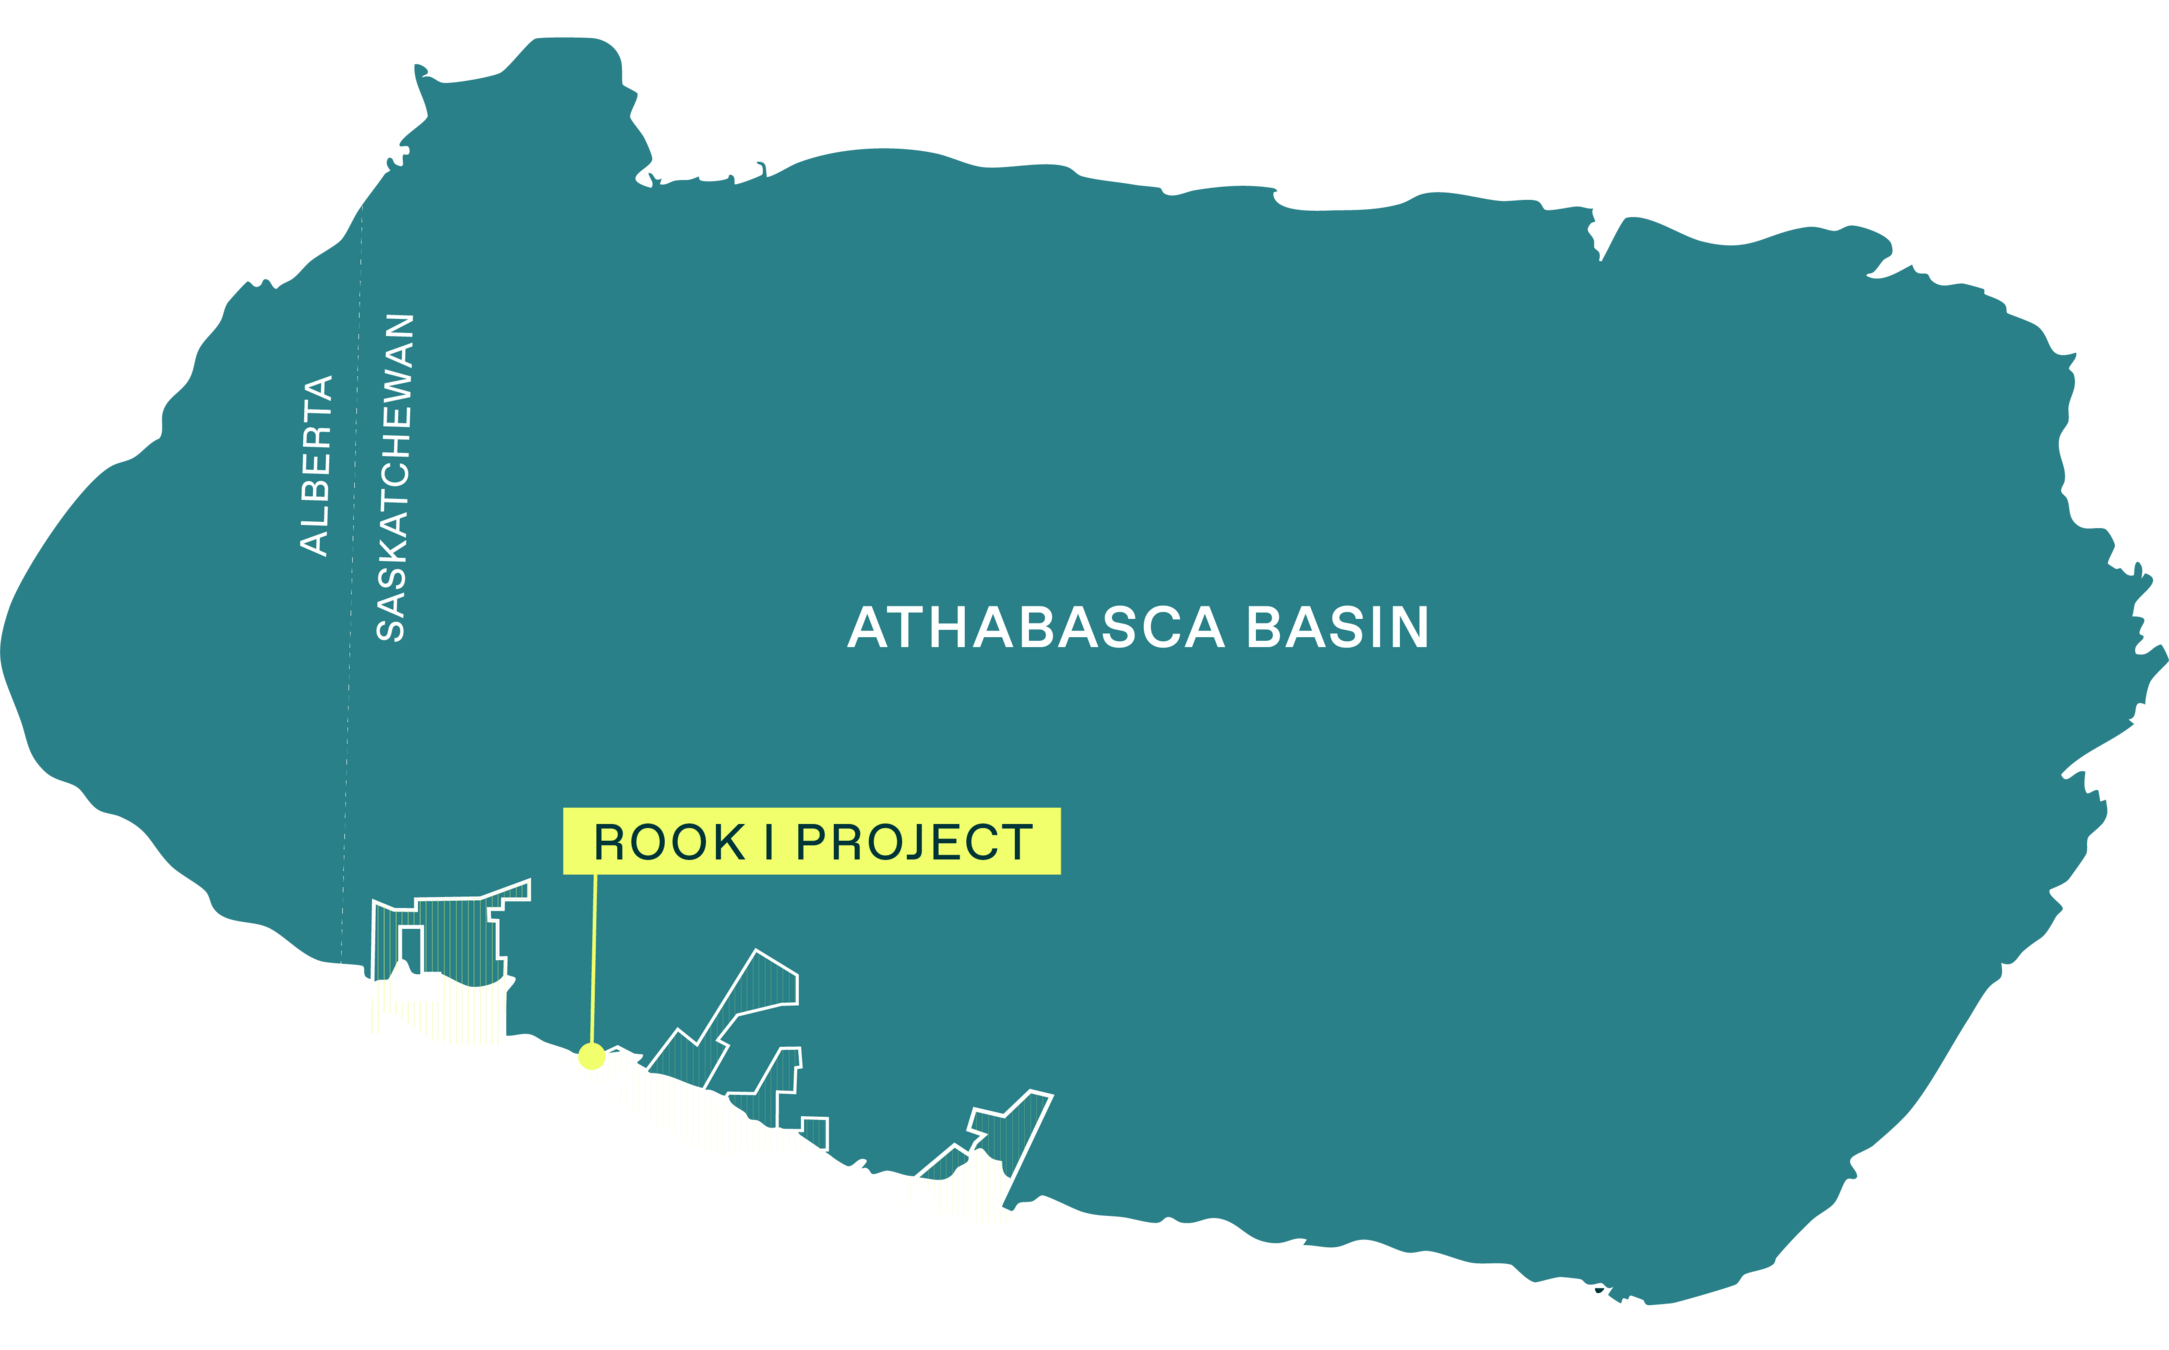
Capable of supplying ~20%¹ of global primary supply and over 50%¹ of western supply, with an active exploration program and a district-scale land position in the southwestern Athabasca Basin, Saskatchewan.
1 Based on calculation of Rook I potential production from the 2021 FS and Centre for International Economics modeling.
2 The current mine plan and economics remain those in the 2021 Feasibility Study
2
NEXGEN | POWERING WHAT’S NEXT
World Class Project
Conventional hard-rock mining with ultra-high grades, delivering up to 30 million lbs annually with expansion potential and robust after-tax cash flow 1,2,3. Re-establishing Canada as the top uranium fuel jurisdiction.
Under Construction
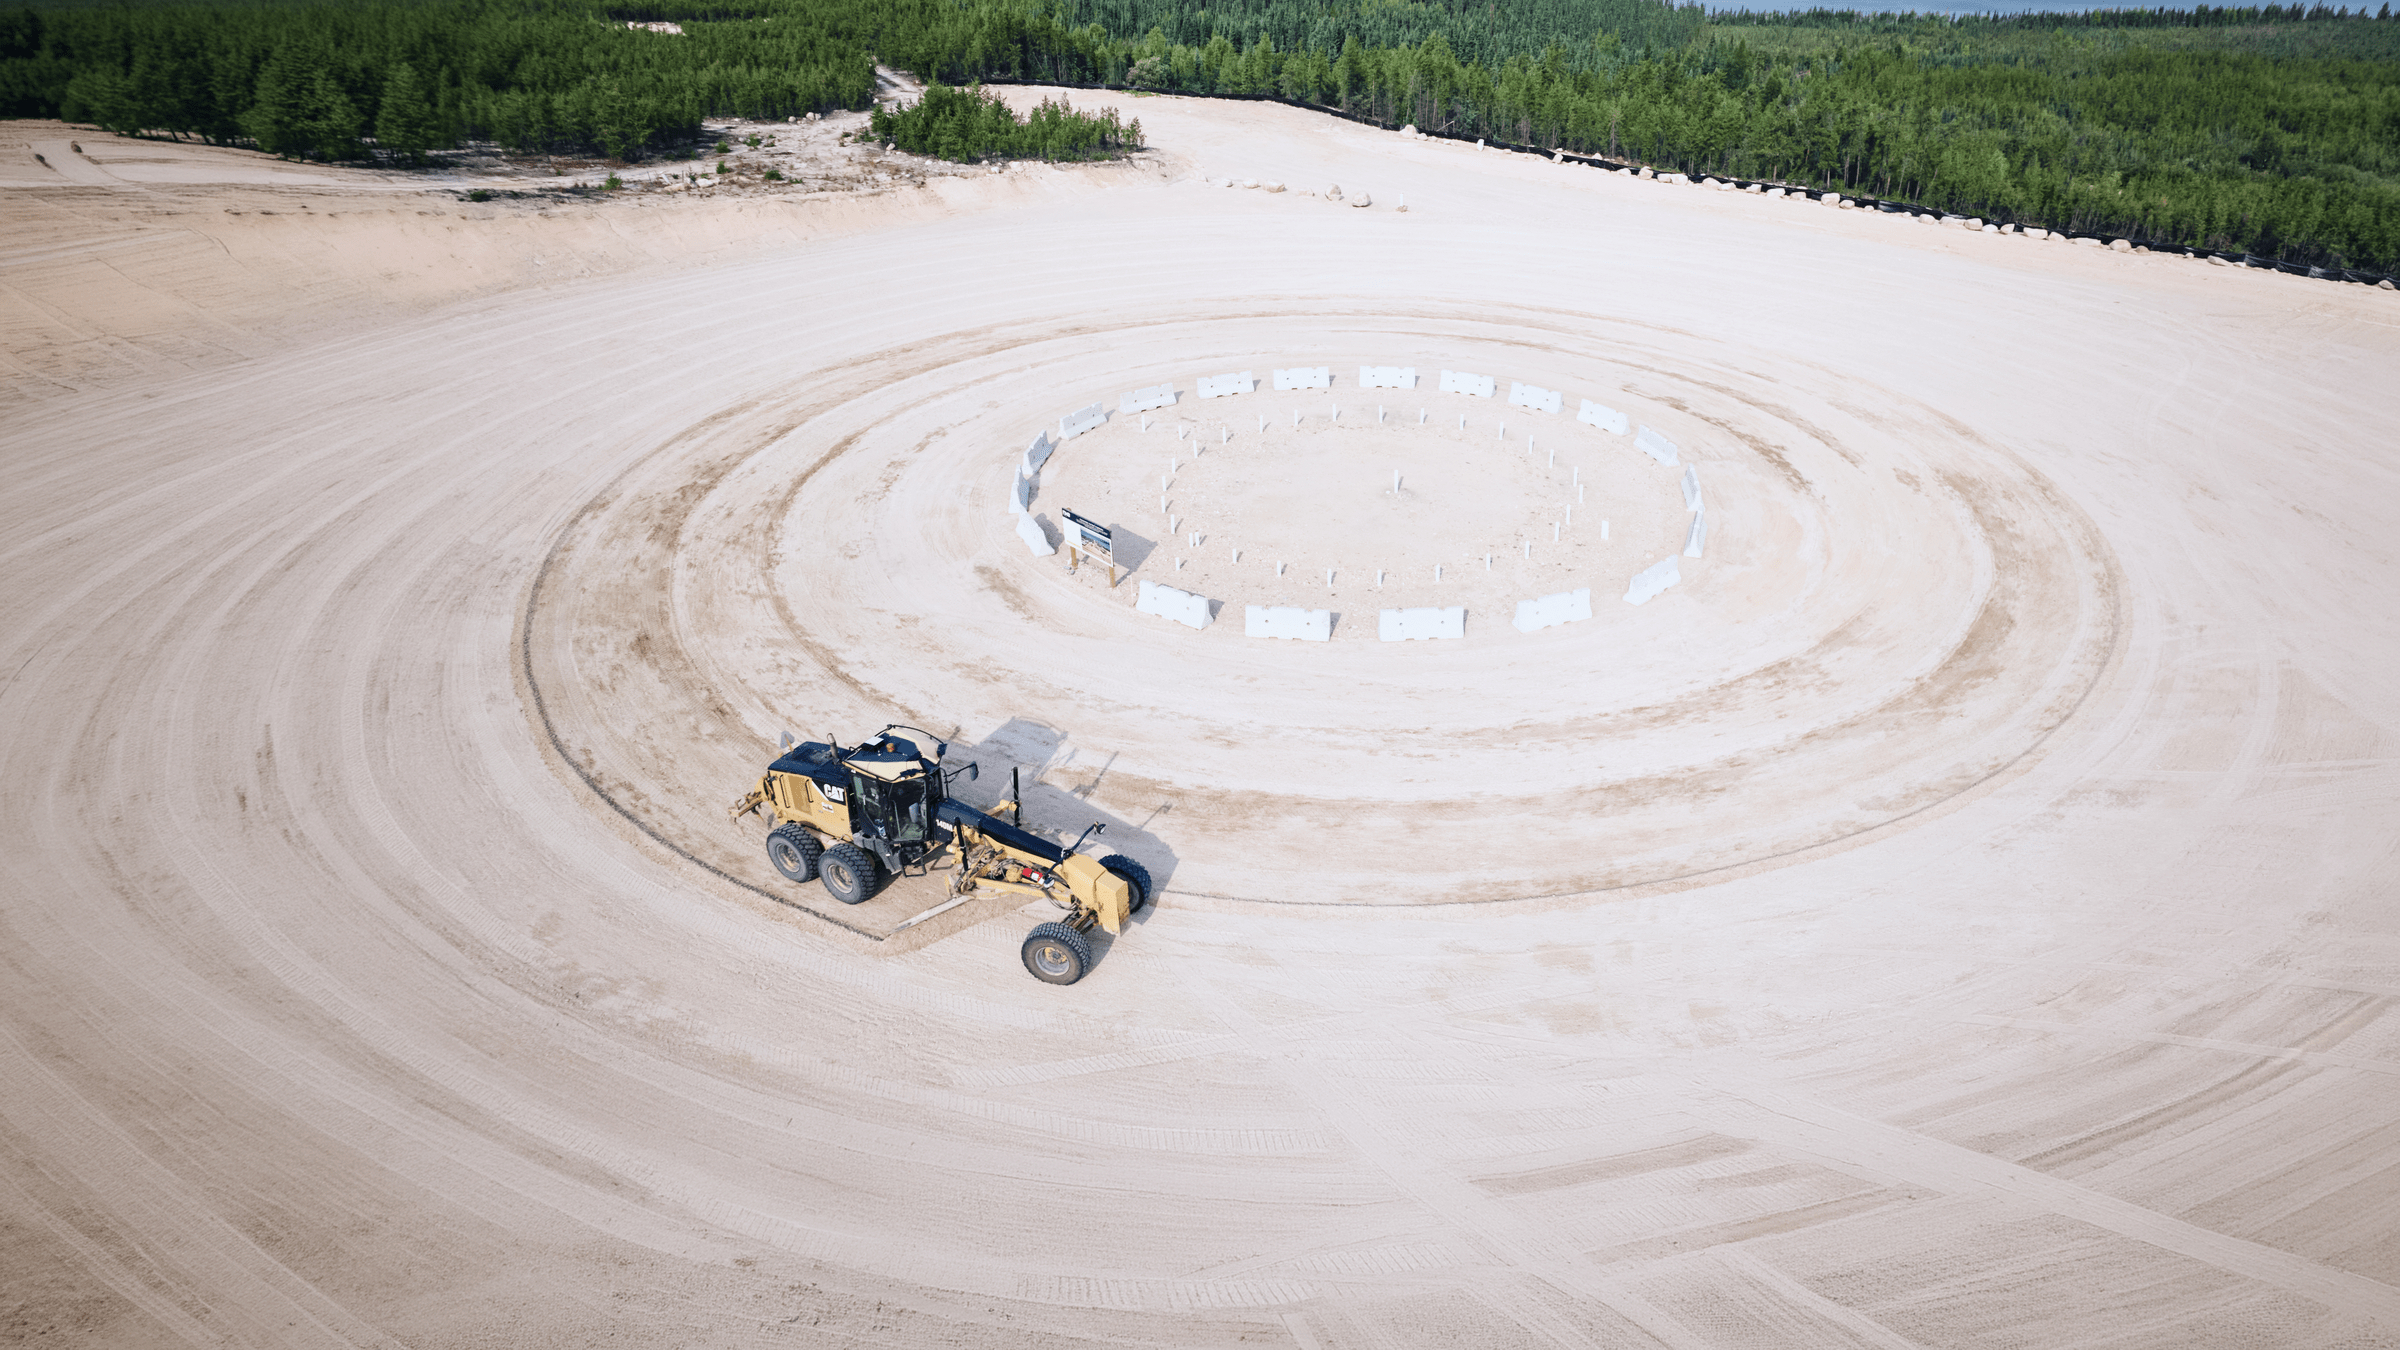
Received approval by the CNSC to construct the Rook I Project on March 5, 2026. Began construction June 2026.
Structural Supply Deficit
Expected to come online when demand surges, legacy supply dwindles, and structural deficit drives long-term prices higher 4.
Leveraged To Rising Prices
Market-related contracting strategy optimizing exposure to future uranium pricing. To date, 11.7 million lbs sales commitments with major utilities have been awarded 2.
Decades Of Relevant Experience
Proven leadership team that has built, financed and operated globally significant mining projects.
Local Support
Formal Indigenous community support through industry-leading Benefit Agreements in Rook I’s Local Priority Area5.
1 Statements regarding future cash flows of the Rook I Project are subject to the various risks and assumptions as outlined in the Company’s AIF, and those further described under the heading “Forward Looking Information” of this Presentation.
2 Refer to August 5, 2025 Press Release for more information.
3 Refer to Rook I Feasibility Study Technical Report.
4 As per the WNA- World Nuclear Fuel Report 2025 – Upper Case Scenario modeling.
5 Refer to NexGen’s most recent Management Discussion and Analysis (“MD&A”).
The world’s most strategic uranium asset.
3

The Market
4

Nuclear is booming.
AI will supercharge demand.
NEXGEN| THE MARKET: URANIUM’S MOMENT
80
441
Reactors under
construction
Operating reactors powering ~10% of global electricity
20% Growth
Adding 88 gigawatts (GW) of new capacity¹ — a ~20% increase in global nuclear capacity by the early 2030s, adding 35–44 million lbs of new annual U₃O₈ demand.
Tripling Capacity
With 38 countries pledging to triple nuclear capacity by 2050², from 380 GW to 1,200 GW, this adds 800 GW of new power. Each 1 GW of nuclear power requires ~200 tonnes of uranium per year.
60
Million pounds of U3O8 required if U.S. AI-demand fully nuclear powered
AI & Data Centre Growth
If the U.S. alone were to power its AI buildout entirely with nuclear, demand would reach up to 60 million lbs of uranium per year by 2030³.
1 World Nuclear Association (WNA)
2 WNA World Nuclear Fuel Report 2025 – September 5, 2025
3 McKinsey & Co, August 2025 - Scaling bigger, faster, cheaper data centers with smarter designs
5
Supply can’t keep up.
By 2040, primary uranium deficit is projected to reach 335 Mlbs per year¹
Uranium demand is surging and structurally inelastic.
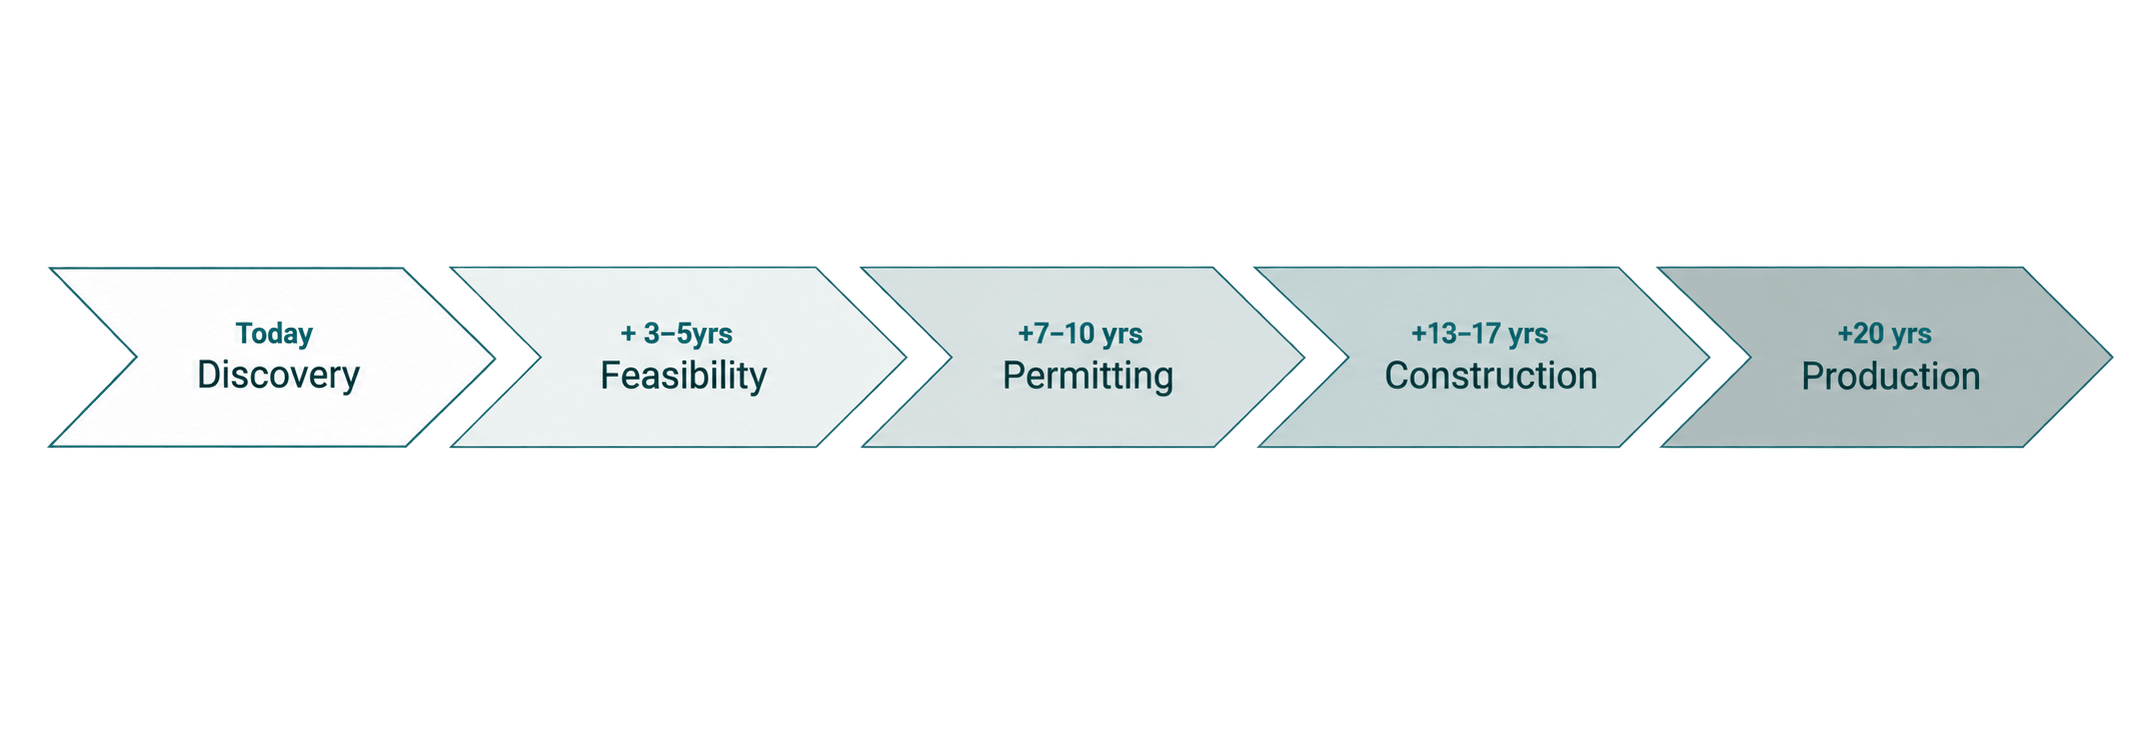
A typical 15 - 20 year timeline from mine discovery to production, means supply cannot respond fast enough.
Higher prices - for longer - are essential to incentivize new production
Meeting forecasted 2040 demand of ~530 Mlbs will require mine supply to more than triple from today’s levels.
A Widening Uranium Supply Gap (Upper Scenario)¹
600
500
400
300
200
100
0
Gap of 16.5% (42 Mlbs)
2030
Gap of 28.7% (109 Mlbs)
2035
Gap of 63.0% (335 Mlbs)
2040
70%
60%
50%
40%
30%
20%
10%
0
Uranium requirements (Mlbs U₃O₈) - Demand
Expected primary supply (Mlbs U₃O₈) - Supply
1 World Nuclear Association (WNA), The Nuclear Fuel Report (September 2025 edition), Section 5.7 “Uranium supply and demand” — Figures 5.11–5.13 and Table 5.13 (Upper Scenario).
NEXGEN | THE MARKET: URANIUM’S MOMENT
Shortage in Million Pounds (Mlbs)
6
A Structural Uranium Supply Deficit Since 1991.
An extraordinary volume of uranium over the next 25 years is required to power the global nuclear fleet.
The world may consume almost as much uranium in the next 25 years as it has mined over the previous 80. Meeting it requires uranium on
a scale approaching the industry's entire historical production.
Source: UxC Q2 2026 Uranium Market Outlook
*Source: Global X, using information from OECD-NEA/IEA and the World Nuclear Association.
NEXGEN | THE MARKET: SUPPLY PARADOX

7
8.6bn lbs U₃O₈ mined over 79 years
1945 (when uranium was first mined) – 2024
It takes 15 - 20 years to bring discovery into production.
HISTORICAL SUPPLY
7.3bn lbs U₃O₈ required over the next 25 years
2025–2050
Forecast uranium required -– the base case of demand.
FORECAST DEMAND
<5
PROJECTS APPROVED
Why prices alone can’t fix a 20-year problem.
SUPPLY CONSTRAINED TODAY AND NEXT DECADE1
Mine development is a 20-year journey from discovery to production:
Last major mines came online in 2014 (Cigar) & 2016 (Husab):
since 2011
2040s
EARLIEST NEW DISCOVERED SUPPLY
comes online
Price signals sent today won’t deliver new supply until
the 2040s.
1 World Nuclear Association, The Nuclear Fuel Report (published September 2025, Reference Scenario) – for uranium requirements
NEXGEN | THE MARKET: SUPPLY TAKES TIME
8
Why prices alone can’t fix a 20-year problem.
PRICE HAS NOT TRIGGERED A SUPPLY RESPONSE2
$17/lb U3O8
~2016 low
~5×
price increase
$90 /lb U3O8
today
160mlb mined
~2016
~14%
supply response at midpoint
~160mlb mined
Despite a 5× price increase, global uranium mined supply is flat.
The industry runs on 20-year timelines, by 2040, the world is short 335 million lbs per year out of 530 million pounds of assumed demand . The gap cannot close without higher, sustained prices.
2. UxC, LLC – Uranium Market Outlook (UMO) (2025–2026)
NEXGEN | THE MARKET: SUPPLY TAKES TIME
9
URANIUM PRICE
2025
Critical supply, foreign reliance.
OECD*: 70% Demand¹, Only 25% Supply²
70% of demand relies on foreign, state-backed sources.
<1% Domestic production from the US, UK, and Europe.
>90% of Western supply tied to long-term contracts below
market pricing.
Rook I is the critical component through to 2040 and beyond diversifying global supply away from geopolitically risky sources but …more new supply is urgently needed.
1 OECD (Organisation for Economic Co-operation and Development) Uranium 2022, Resources, Production, Demand
2 WNA - World Nuclear Fuel Report 2023 – Upper Case scenario
70%
OECD Demand
OECD Supply
Opportunity to Fill the Gap
NEXGEN | THE MARKET: FOREIGN RELIANCE
Fulfilment Gap 45%
25%
10
Every reactor needs fuel. Fuel is the bottleneck.
U308
→
Nuclear Services
→
Nuclear Reactor
→
Energy Infrastructure
→
Connect Clean Economy
The key driver, and limiting factor of industrial growth is the fuel itself (U3O8).
NEXGEN | THE MARKET: FUEL BOTTLENECK
The entire nuclear chain, from reactor to grid to clean economy, depends on a single input. Uranium.
The fuel is the bottleneck. And the fuel is what we produce.

11
The Asset
12
The Future
Of Good Energy
NexGen is positioned to produce up to 30 million pounds a year, enough uranium to power cities, nations and underwrite the nuclear renaissance.
NEXGEN | THE ASSET: ROOK I
One mine. 20% of the world’s uranium.
At a time when it’s needed most.
13
The unrivaled Arrow deposit.
Grade and geology make this one of the most robust, economically resilient deposits in the world.
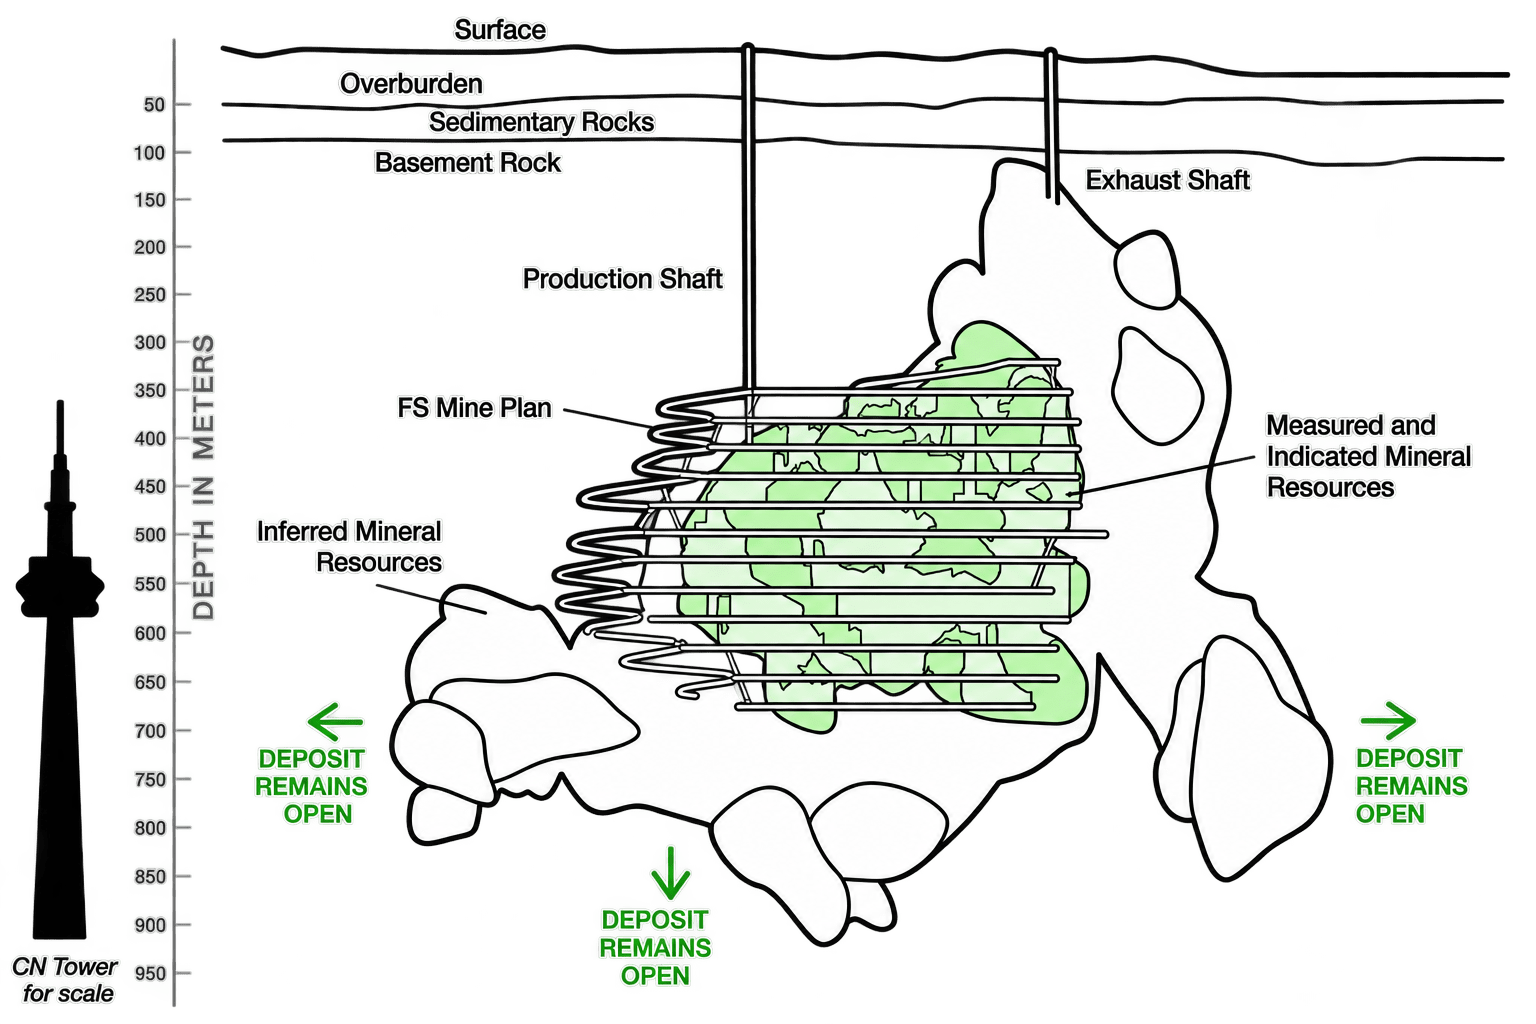
- Reserves grade 2.37% for 239.6 million lbs. Over 65%¹ of Measured & Indicated resource at 15.9% U3O8, 160x the global average² ˒³
- Simple, predictable structure allows for conventional, safe, and efficient mining³
- Hard rock conditions allow for underground tailings storage which reduce surface tailings exposure to near zero³
Reserves and resources:
Economics based on probable reserves of 239.6 Mlbs as outlined in the 2021 Feasibility Study.
Total Measured & Indicated resource of 256.7 Mlbs (inclusive of reserves) and Inferred resource of another 80.7 Mlbs³.
Probable mineral reserves
Indicated mineral resource
Inferred mineral resource
Remains open along strike and at depth · 1KM
1 Additional details regarding Mineral Reserves and Mineral Resources can be found in the FS and the Appendix of this presentation. Mineral Resources are inclusive of Mineral Reserves. Mineral Resources that are not Mineral Reserves do not have demonstrated economic viability. ·
2 WNA – Uranium Mining Overview. September 25, 2025 ·
3 Rook I Feasibility Study, 2021
14
NEXGEN | THE ASSET: ROOK I
Conventional mining: Arrow’s unique advantage.
Uranium can be mined using several methods, dependent on the deposit’s geology and grade. Arrow’s geology is rare in uranium mining, more analogous to high-grade underground gold in hard rock than typical uranium deposits. And that’s a good thing. The depth, hard rock setting, and exceptionally high grades¹ provide ideal conditions for conventional underground mining, resulting in low operating costs.
Open Pit Mining
- Near-surface ore, large-scale surface digging
- Typically, low grade <0.5% U3O8
- ~20% of global production uses this method
- Environmentally disruptive and difficult to control
In-Situ Recovery
- Soft, wet rock (e.g., sandstone aquifers)
- Very low-grade mines <0.3% U3O8
- Complex metallurgy and recovery rate consistency
- ~60% of global uranium production use this method
Freeze Mining in Sandstone
- Water-saturated, unstable formations that are technically complex
- Requires continuous ground freezing years in advance
- Complex geotechnical and metallurgical characteristics
- ~20% of global uranium production use this method
ARROW’S MINING METHOD
Underground Mining in Hard Rock
- Competent, hard rock with minimal hydraulic activity
- Shafts and tunnels to access ore, and higher recovery rates
- Well understood, commonly used method for hard rock mines
- Provides unique production flexibility optionality
SANDSTONE · ARROW · Crystalline Basement Rock · Freeze Pipes
1 Additional details regarding the geological setting and mining methods within Arrow can be found in the 2021 Rook I FS.
NEXGEN | THE ASSET: ROOK I
15
Major construction has commenced.
PERMITTING TIMELINE
Sept 2023
Federal License Application Deemed Sufficient
Nov 2023
Provincial Environmental Assessment Approved
Nov 2024
Federal Technical Review Complete
Nov 19 2025
CNSC Hearing
(Part 1)
Feb 9–13 2026
CNSC Hearing
(Part 2)
Mar 5 2026
Final Federal Approval Granted
June 2026
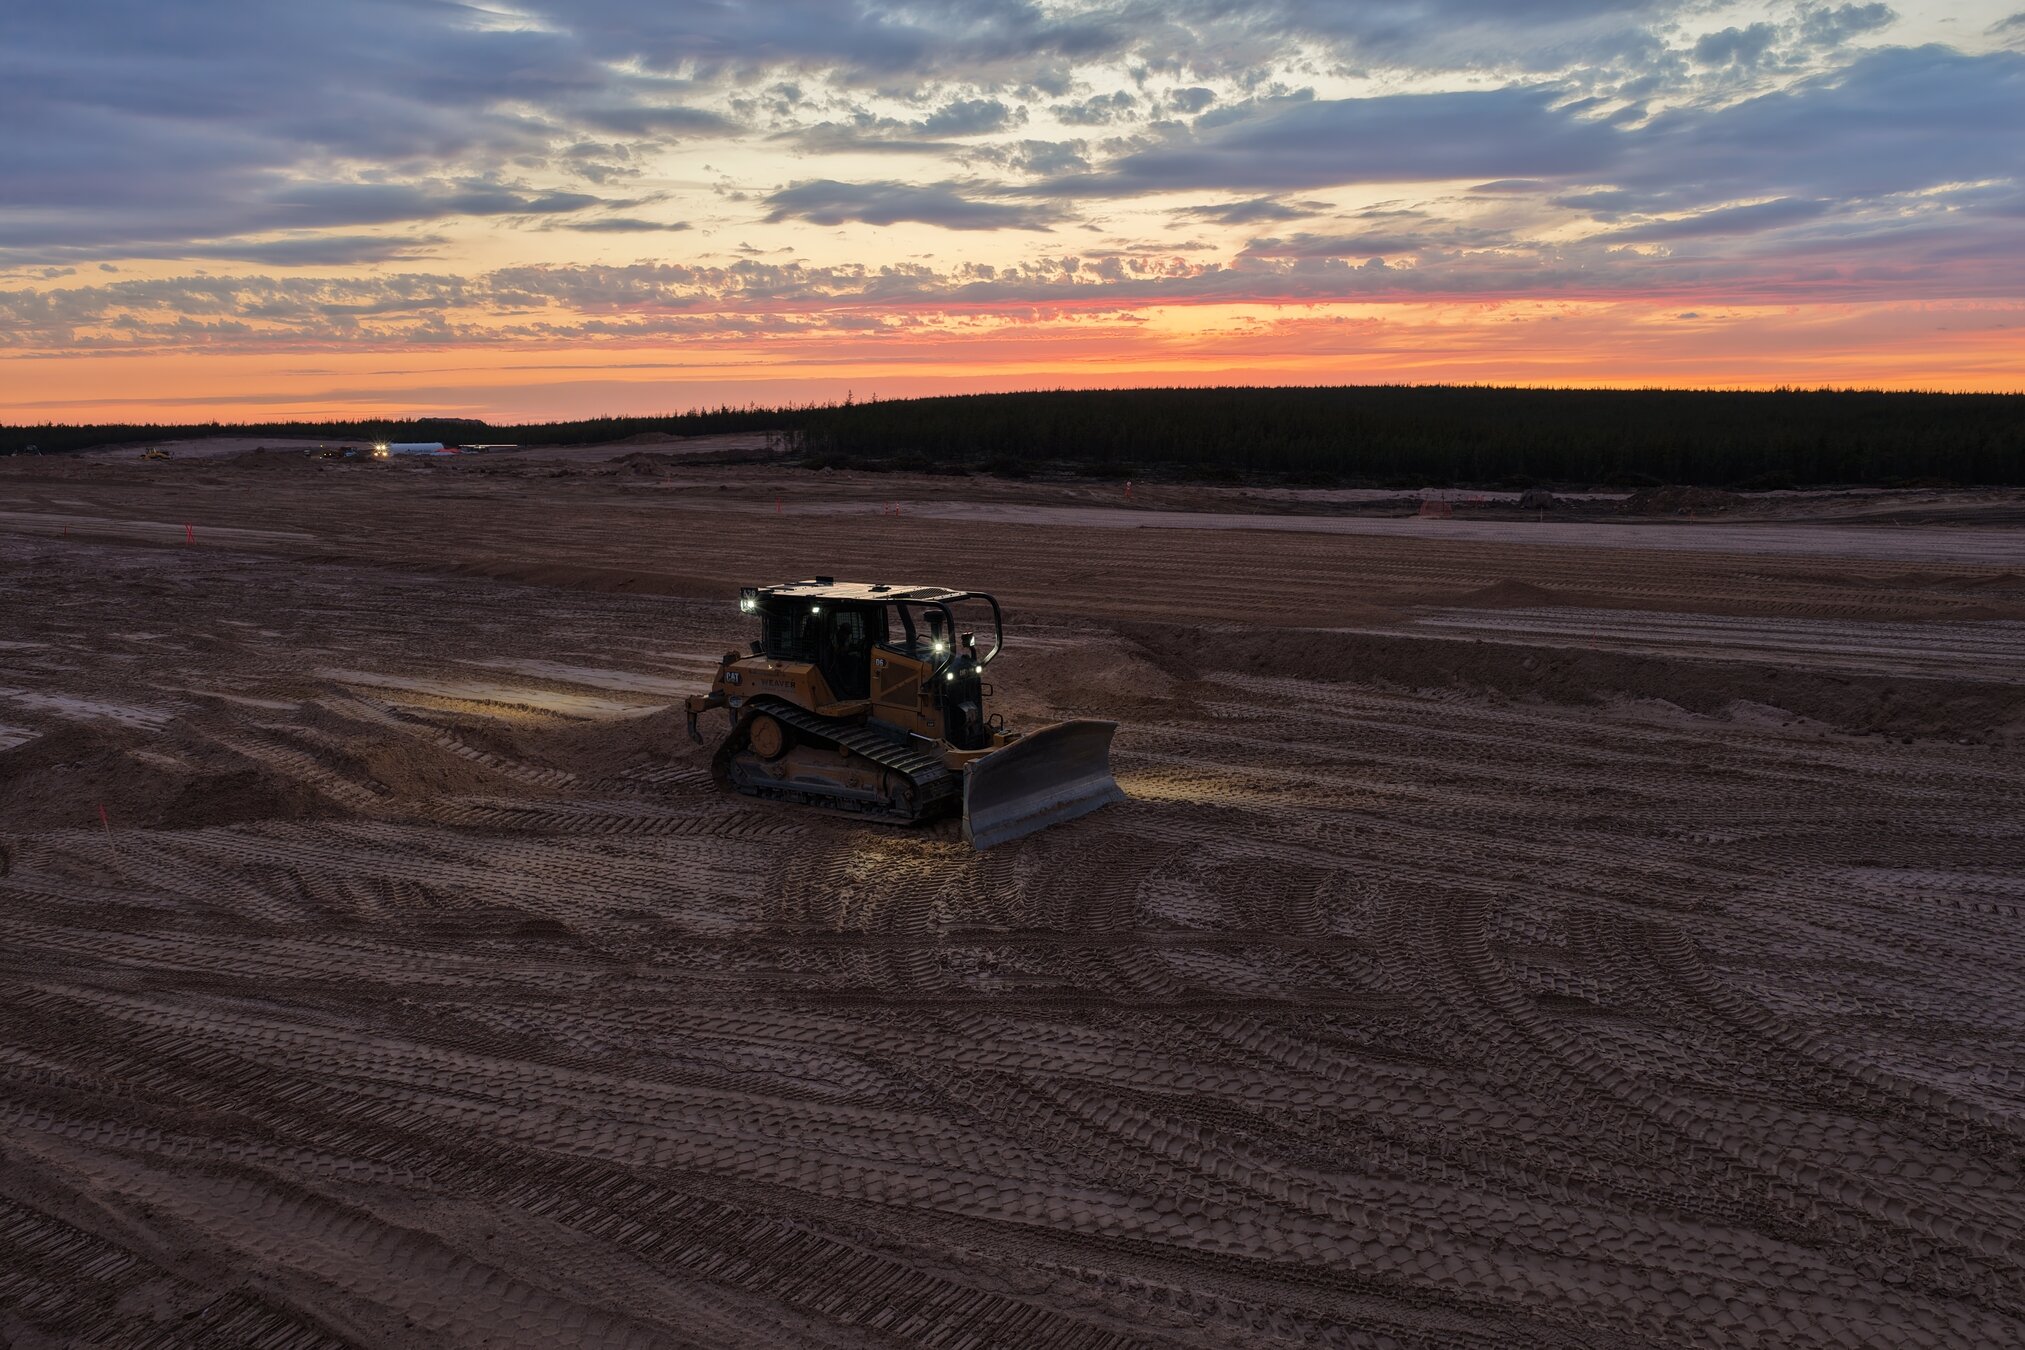
Major Construction Began
CURRENT STATUS
Completed materially on time and schedule:
✓3,000-ft airstrip complete
✓An additional 373-bed hard-walled camp, fully commissioned, complete and occupied
- Advancing major earthworks and surface infrastructure
- Site road networks
Current ongoing site construction — Q3 & Q4 2026:
- Production and exhaust shaft mine terrace pads
- Concrete foundations for the shaft headframes, hoist house and winch house
- Installation of temporary freezing plant
- Primary batch plant erected
NEXGEN | THE ASSET: ROOK I
16
✓ Effluent diffuser installation and road access
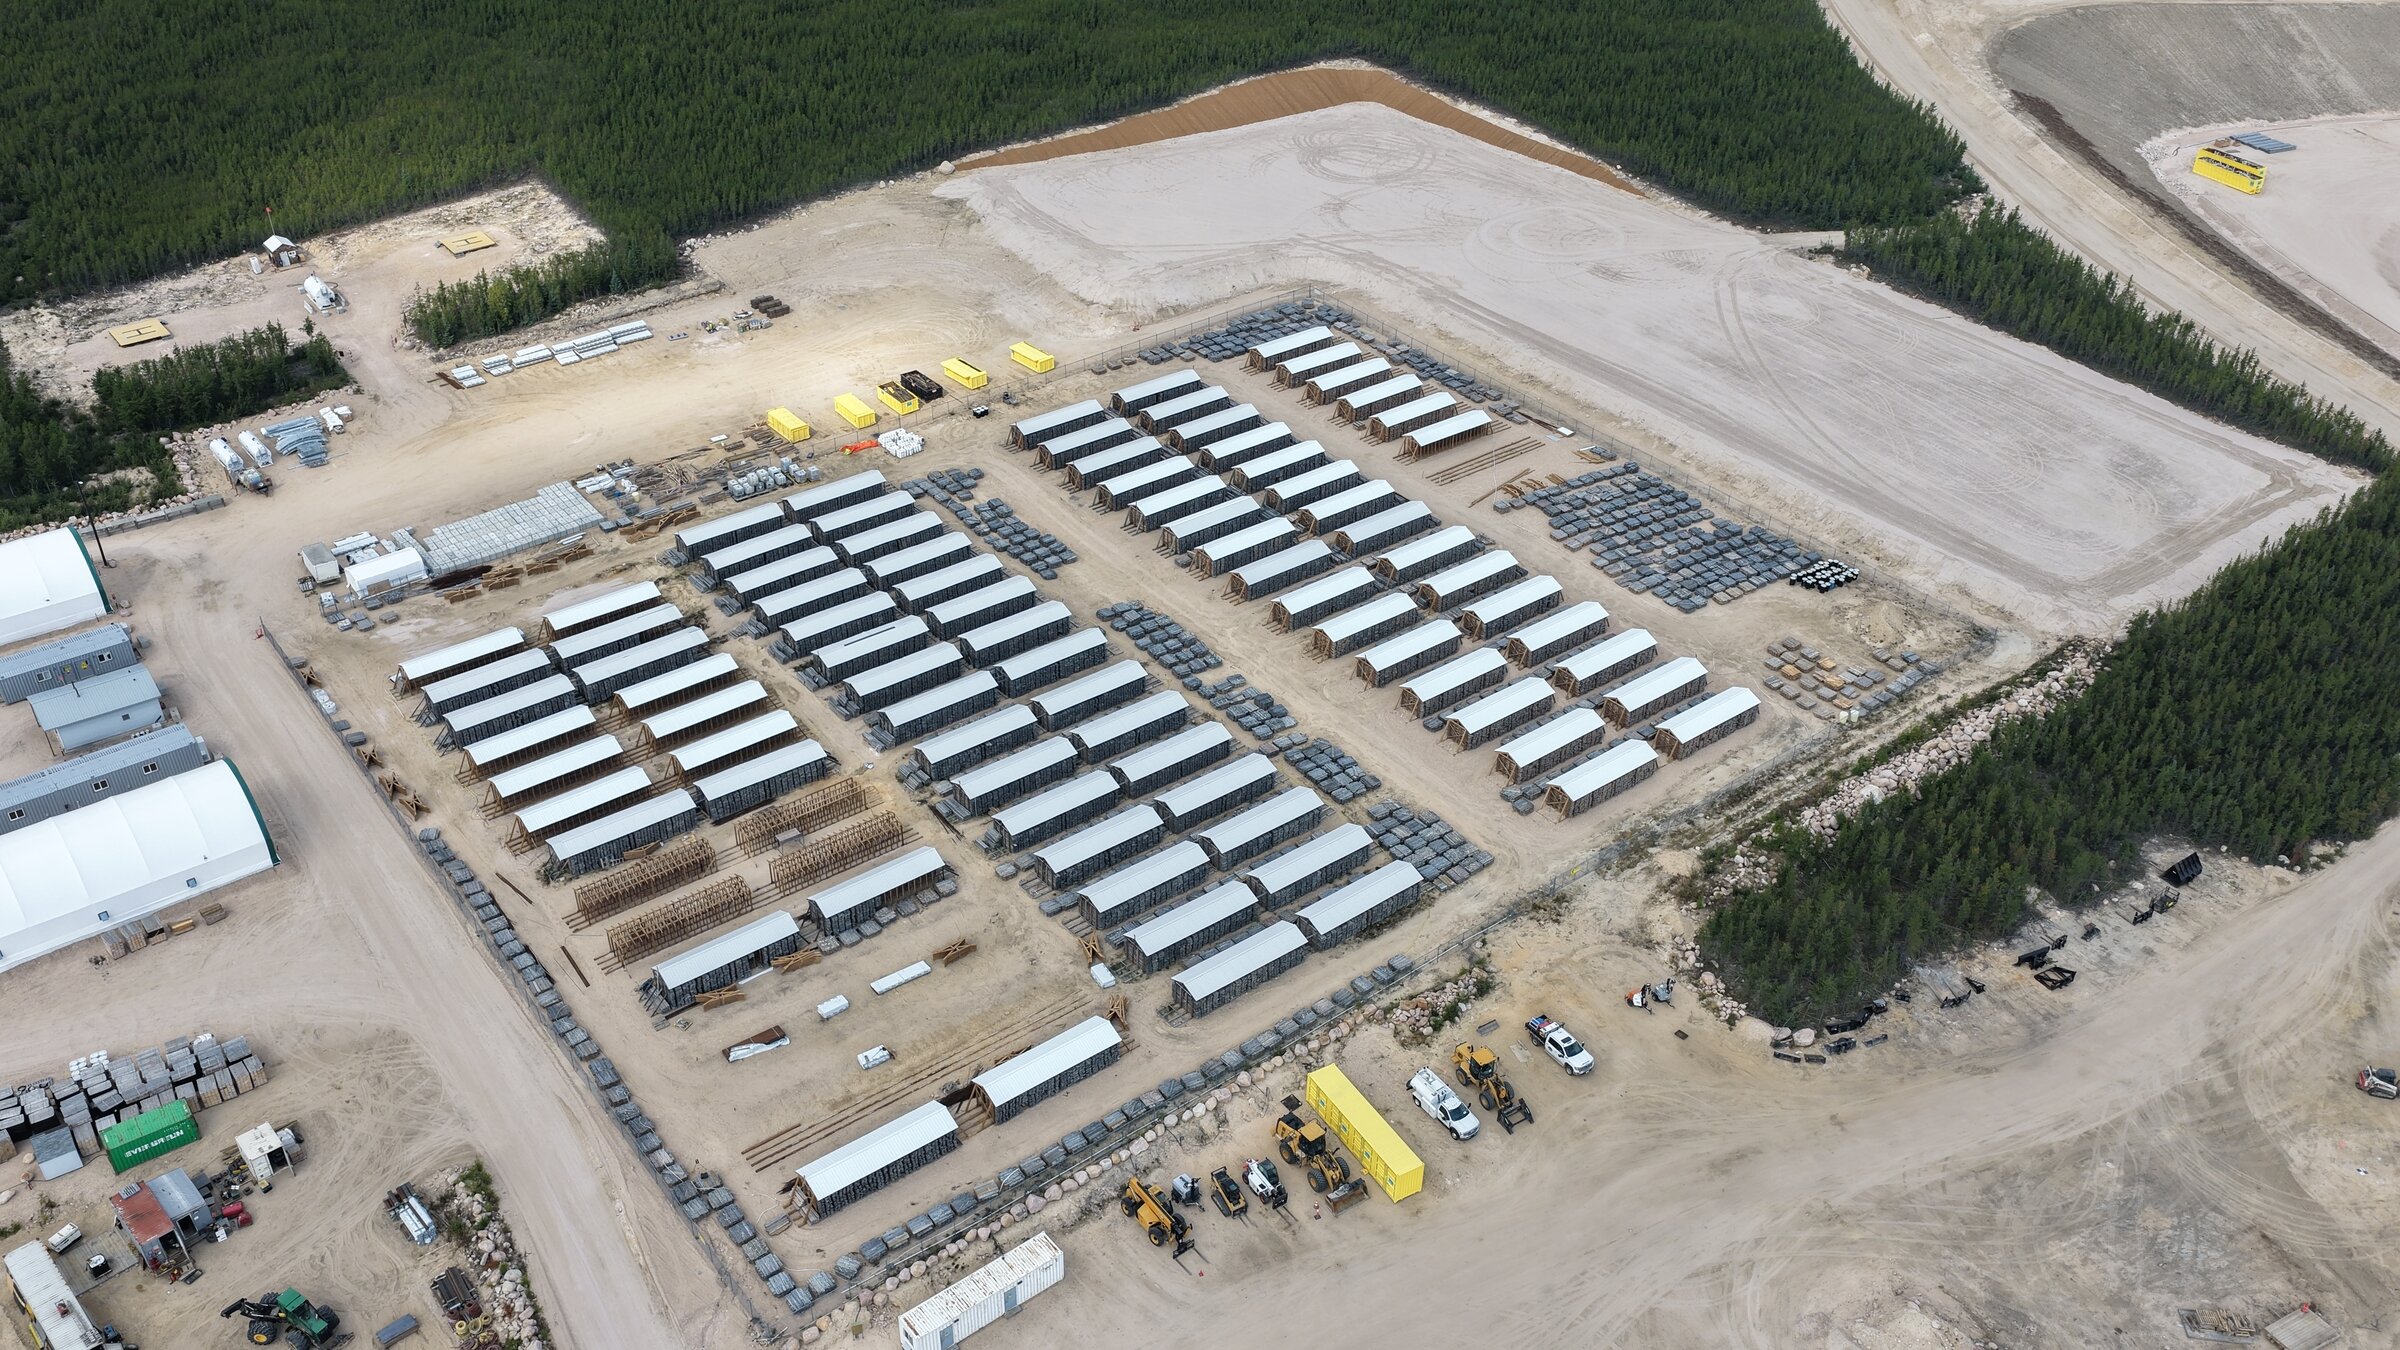
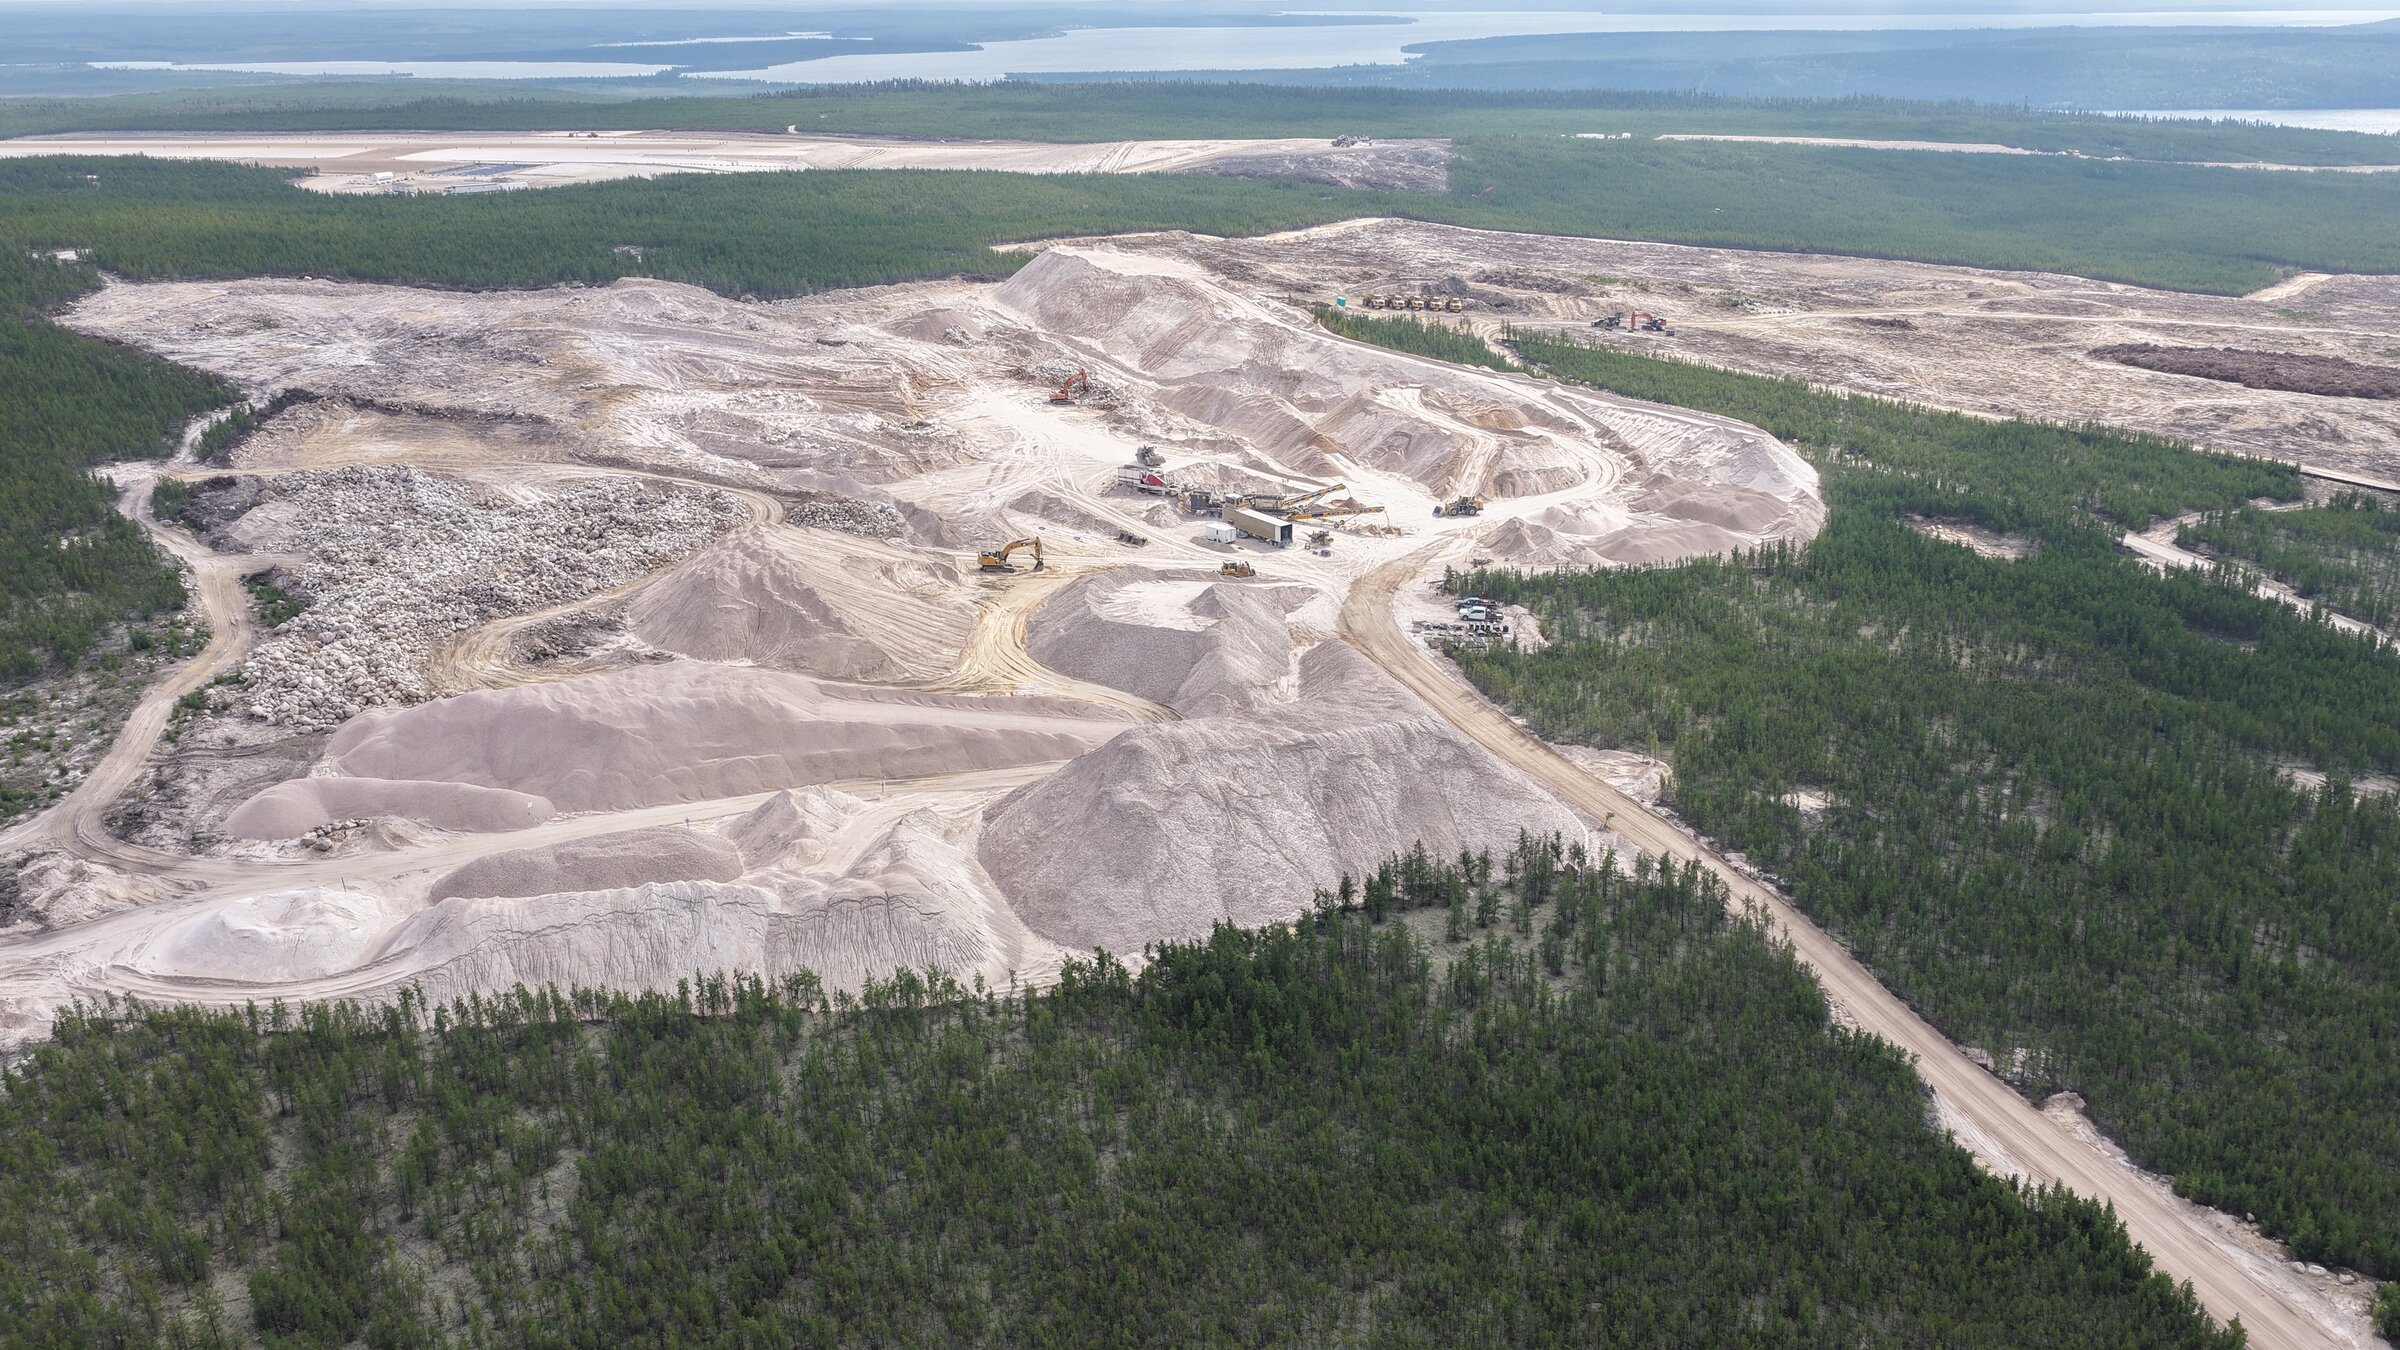
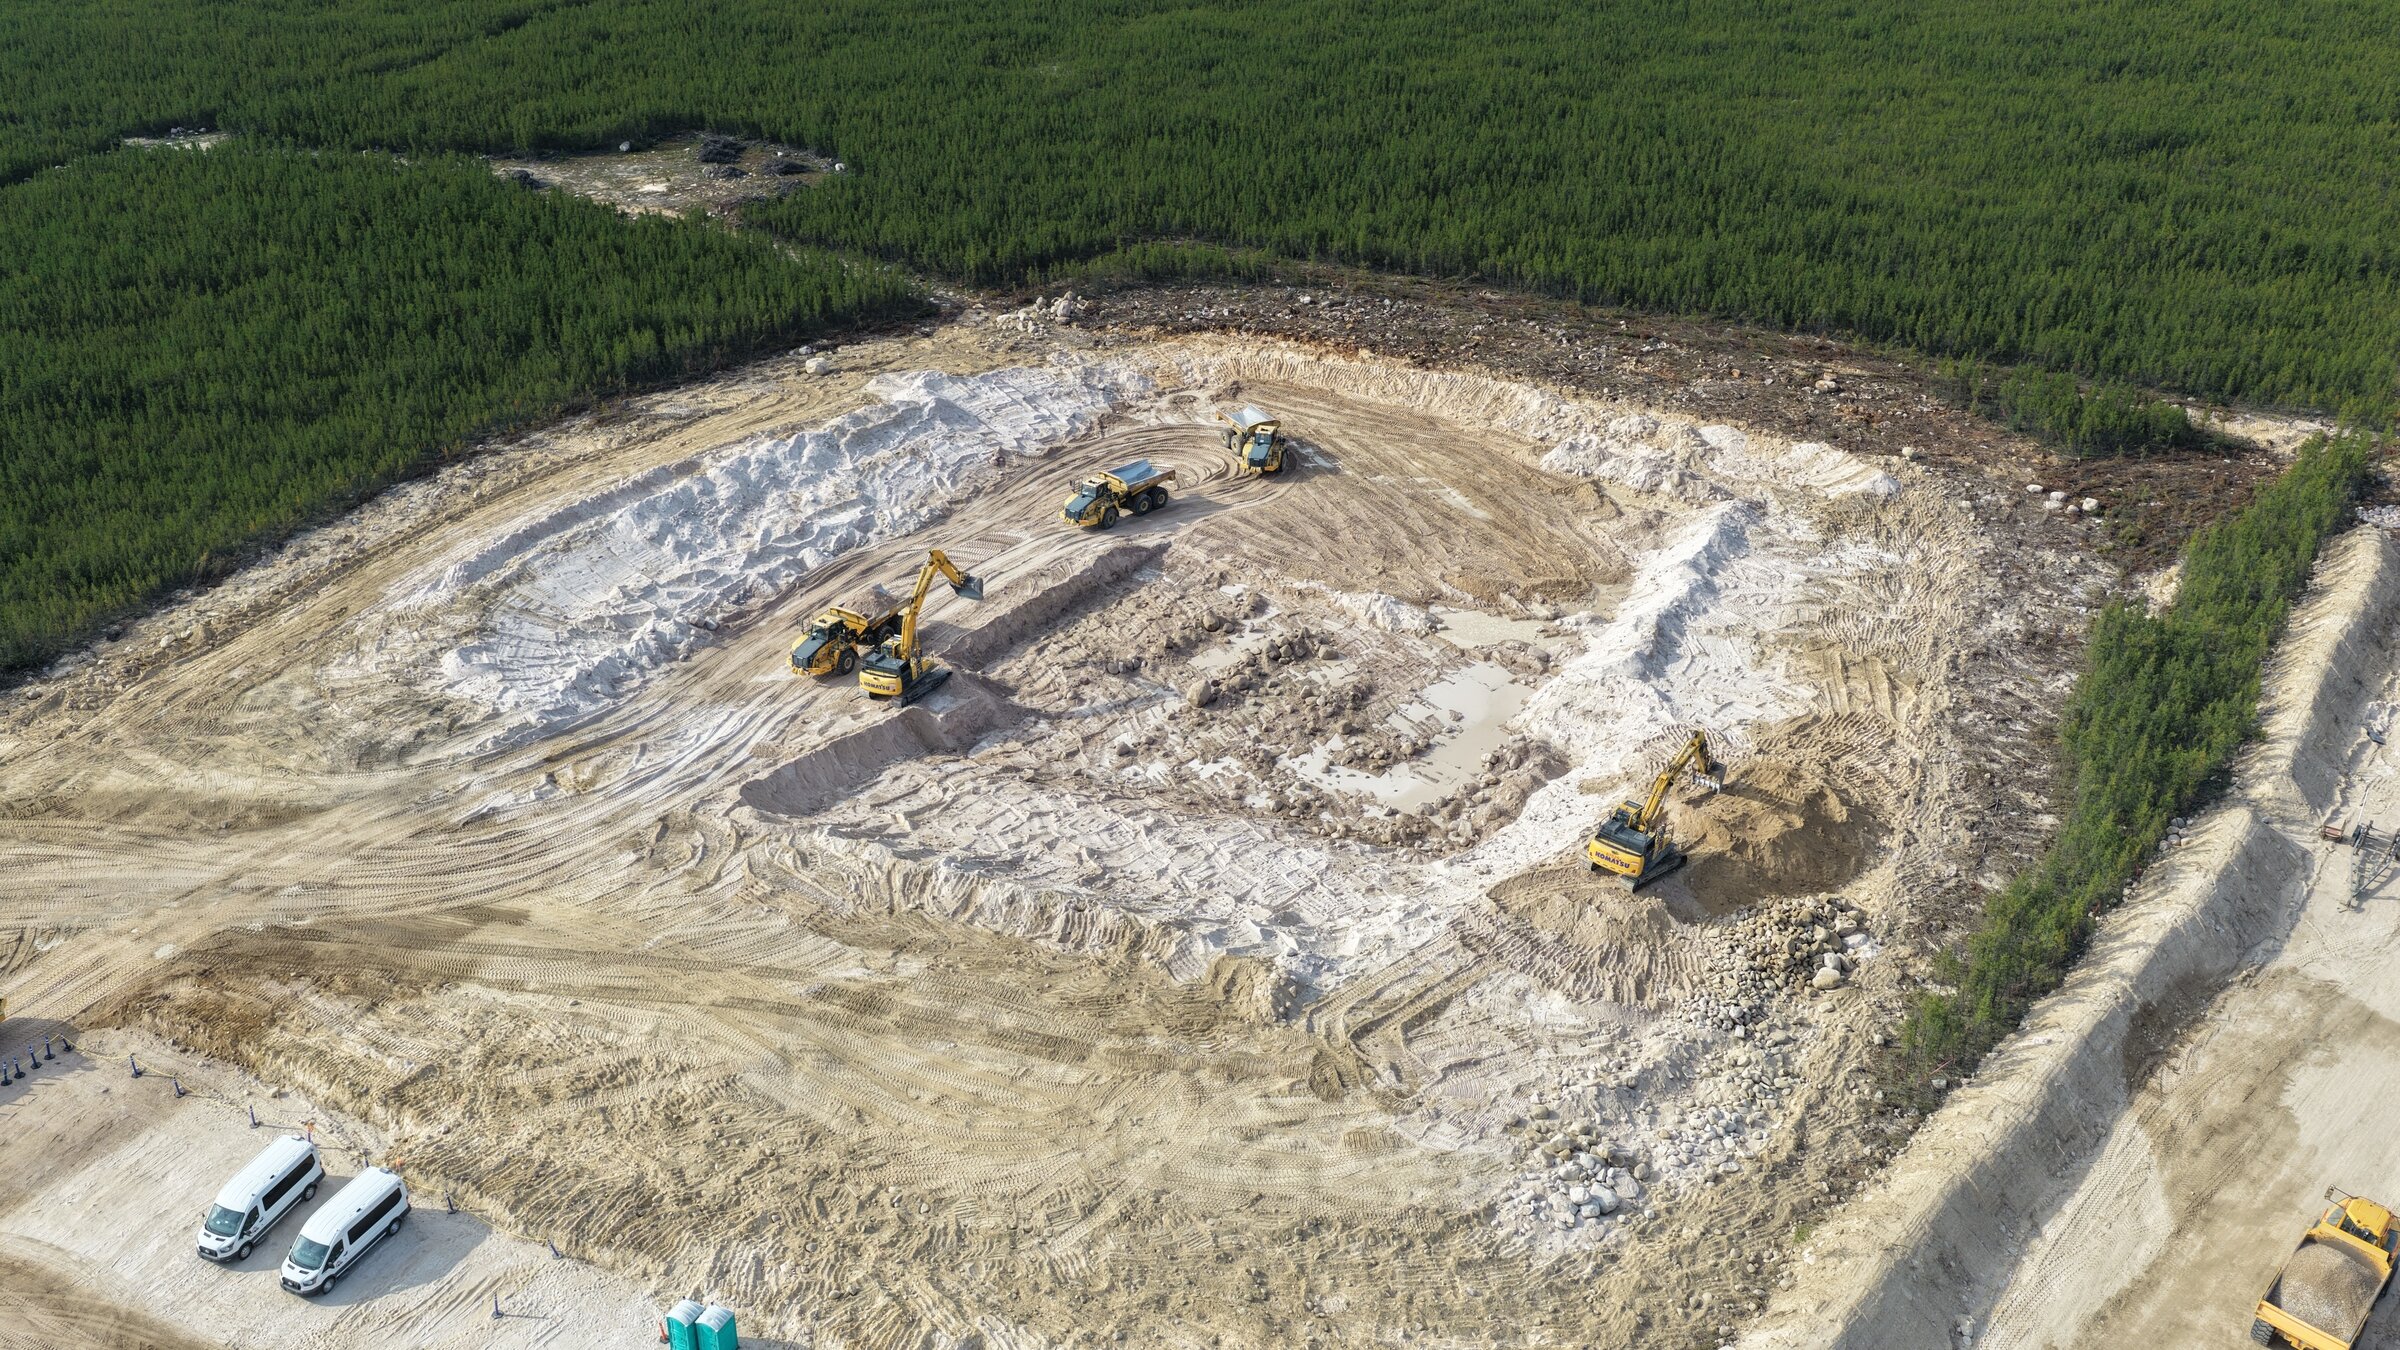
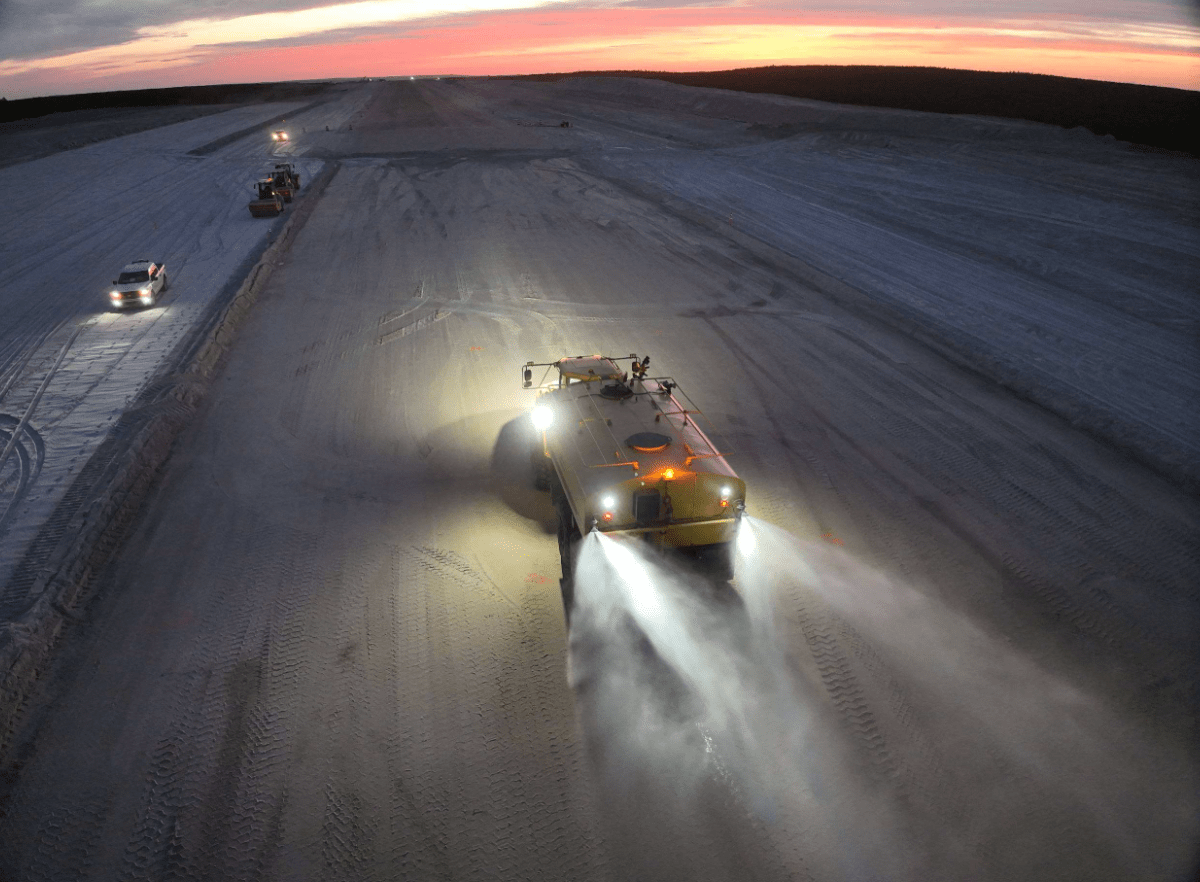
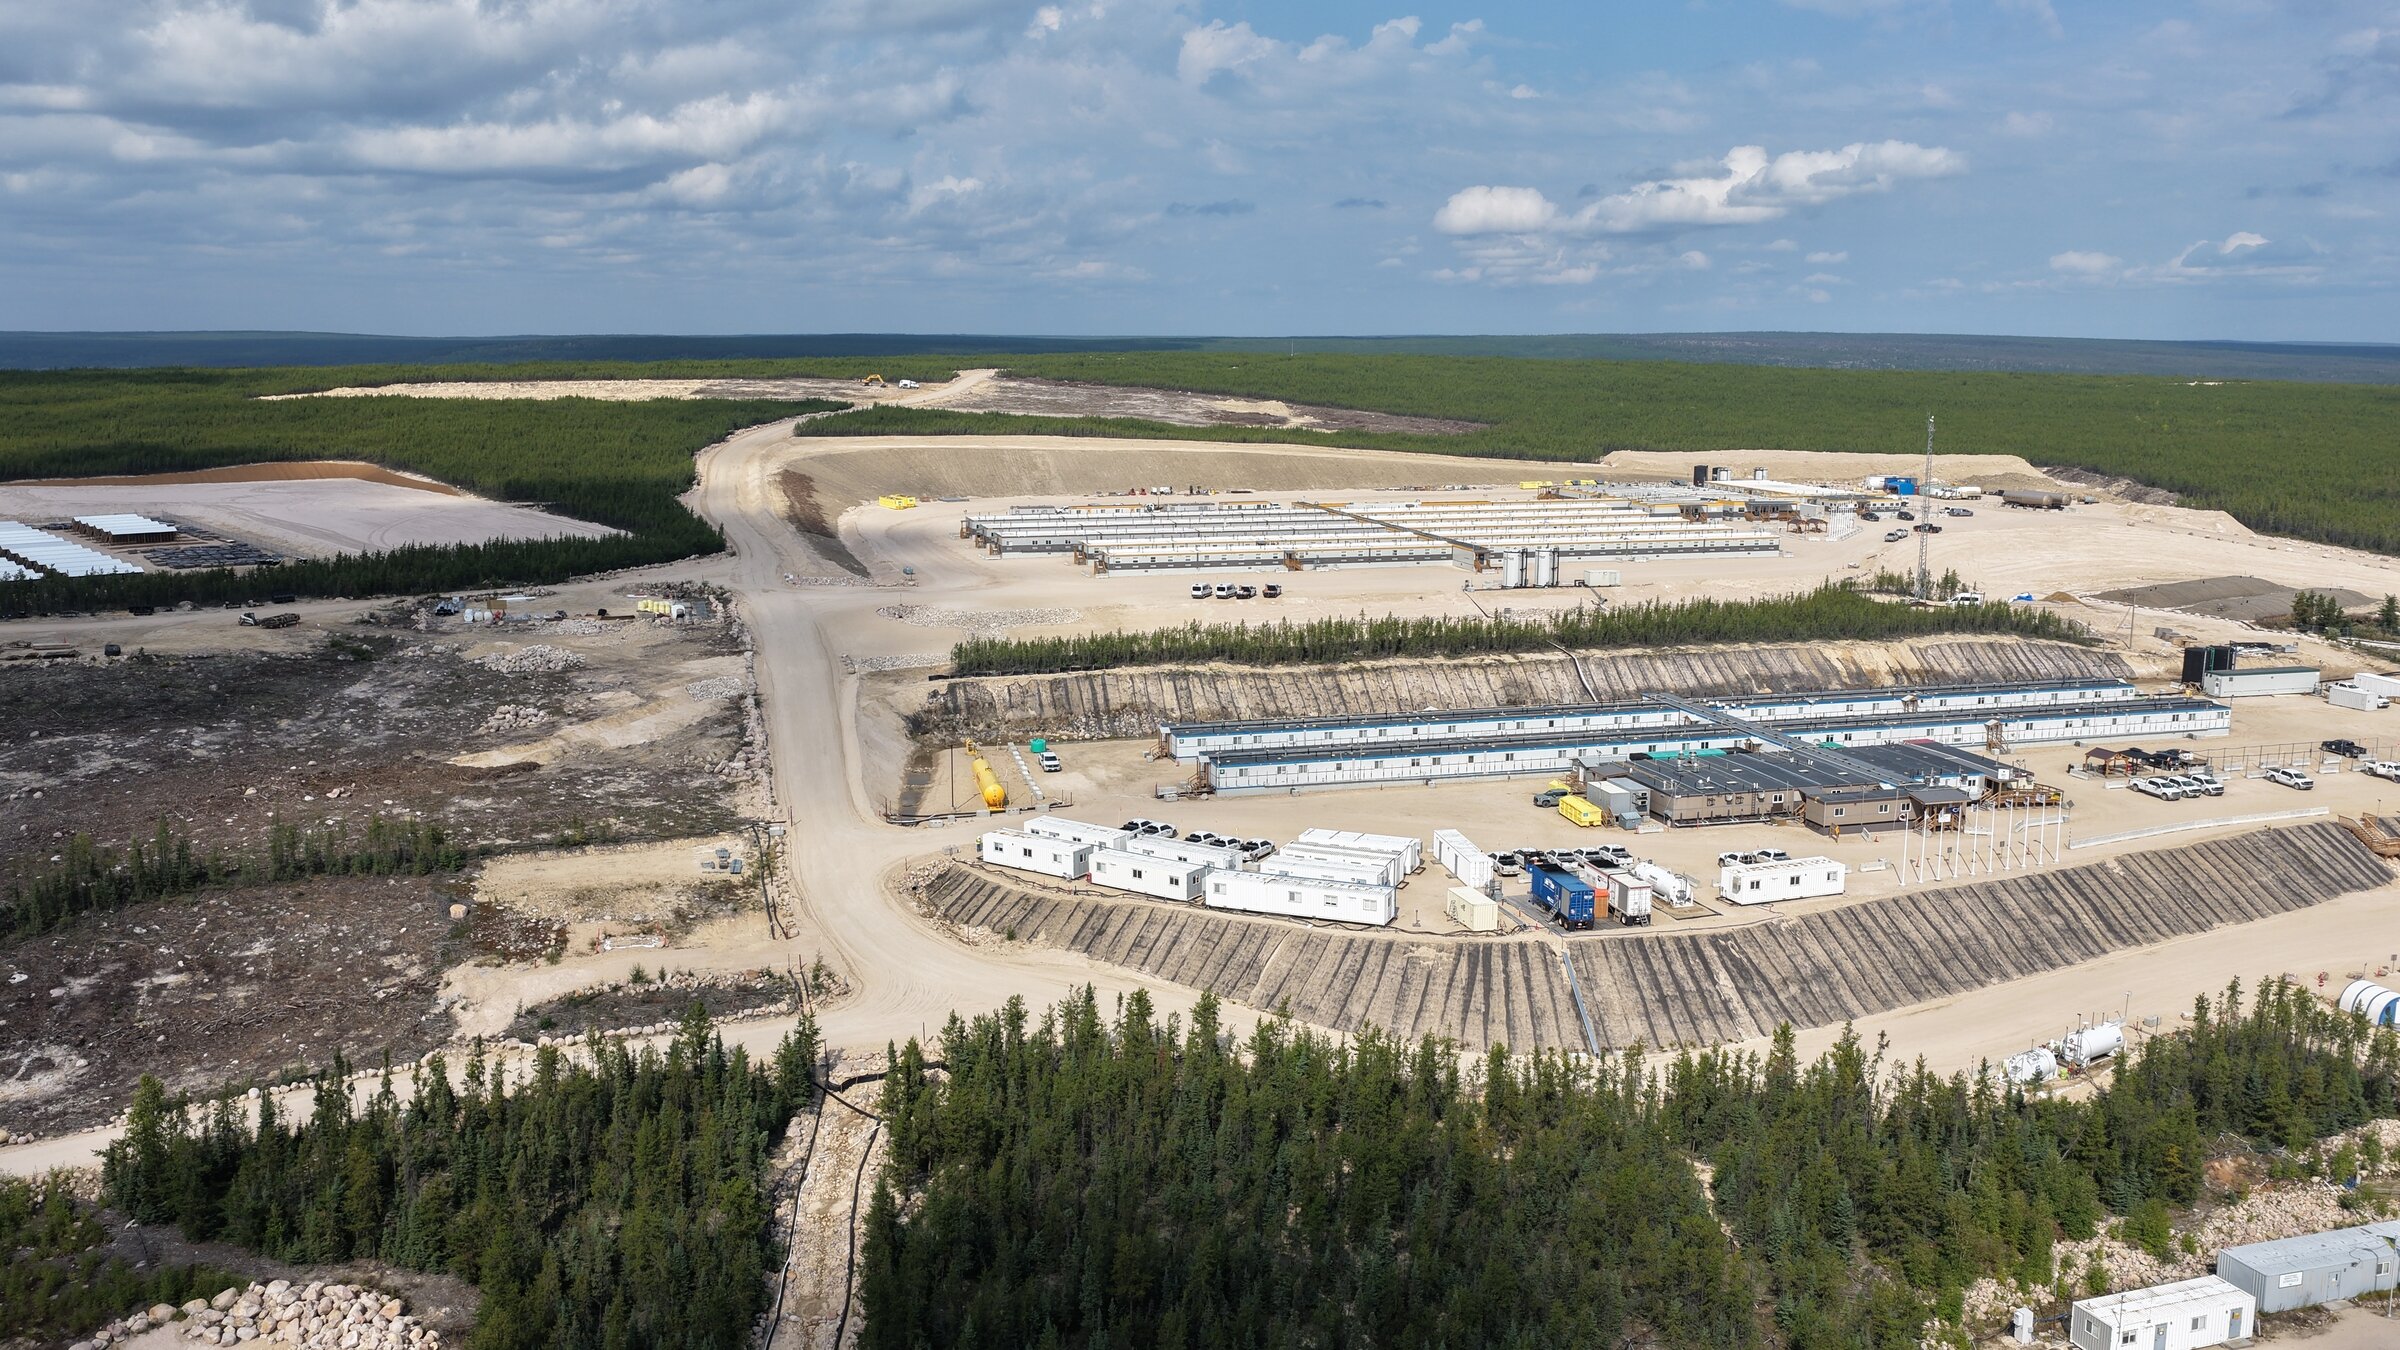
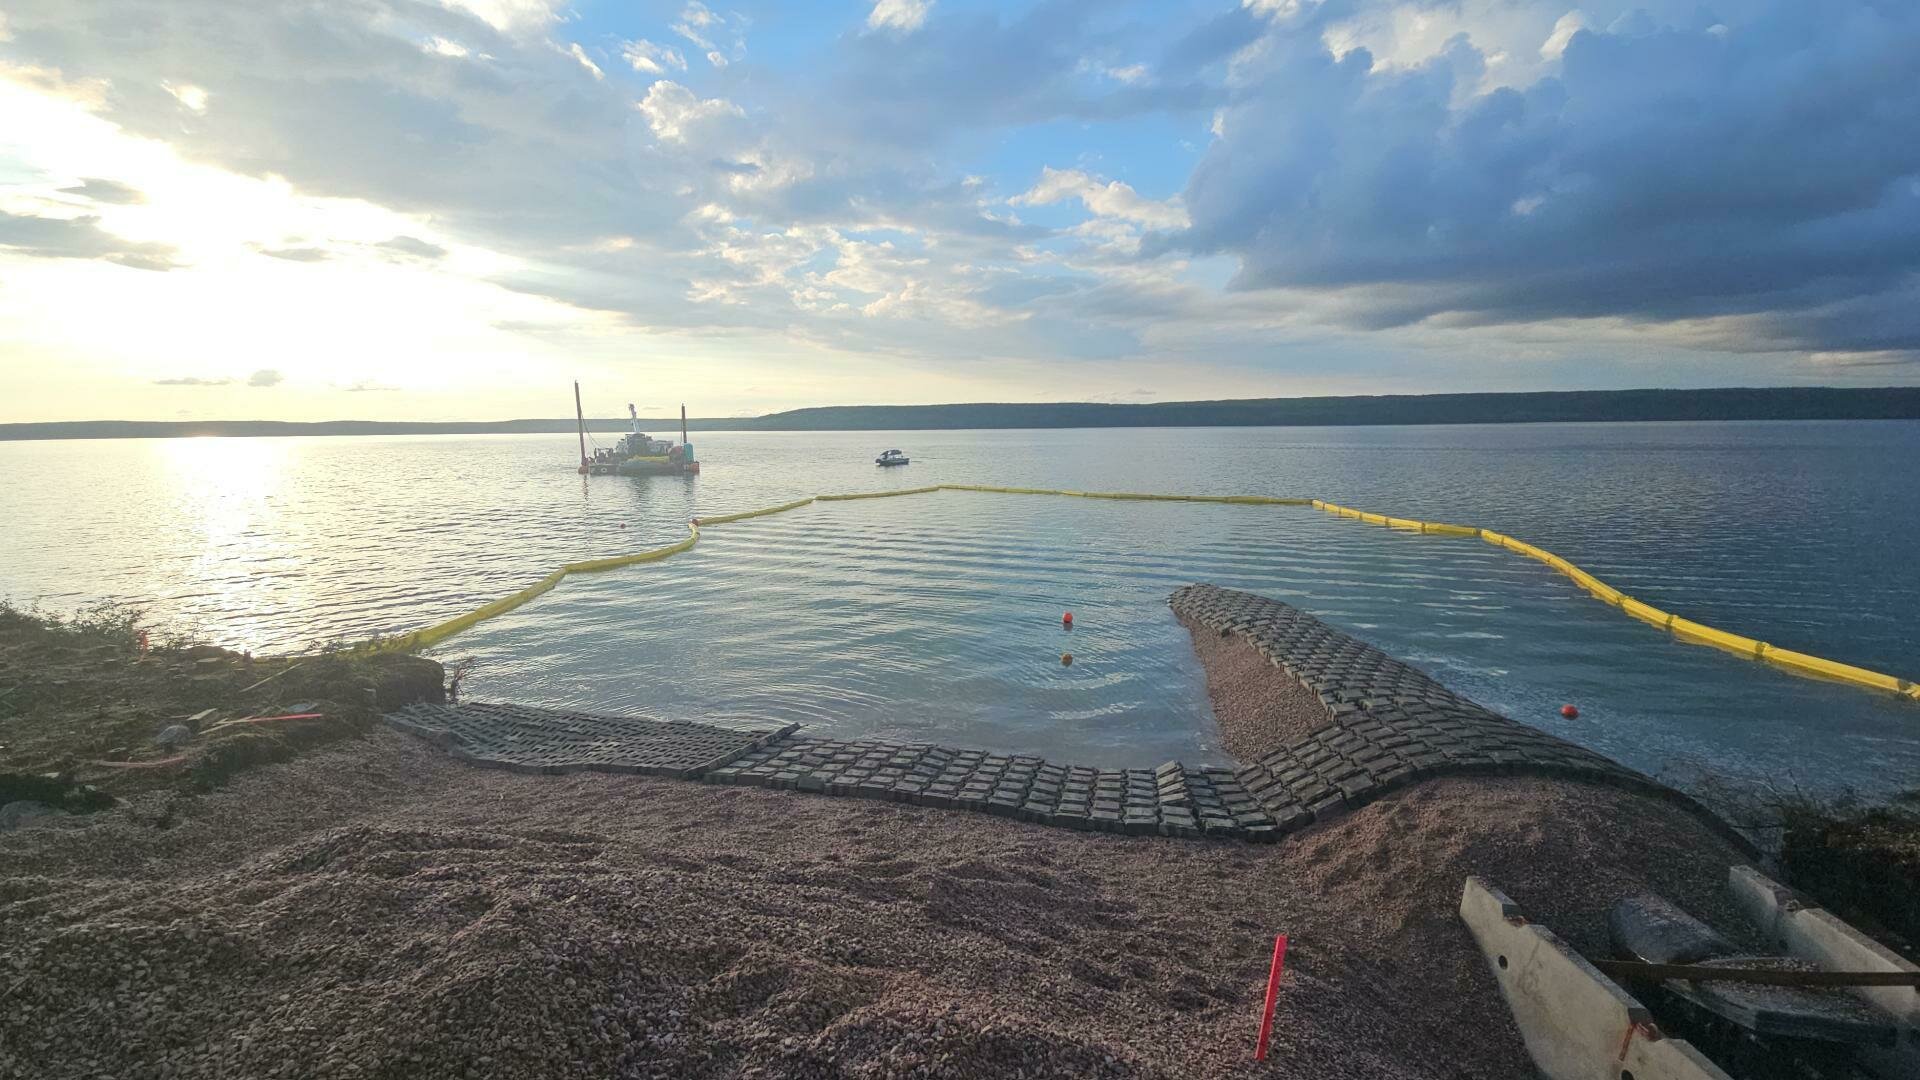
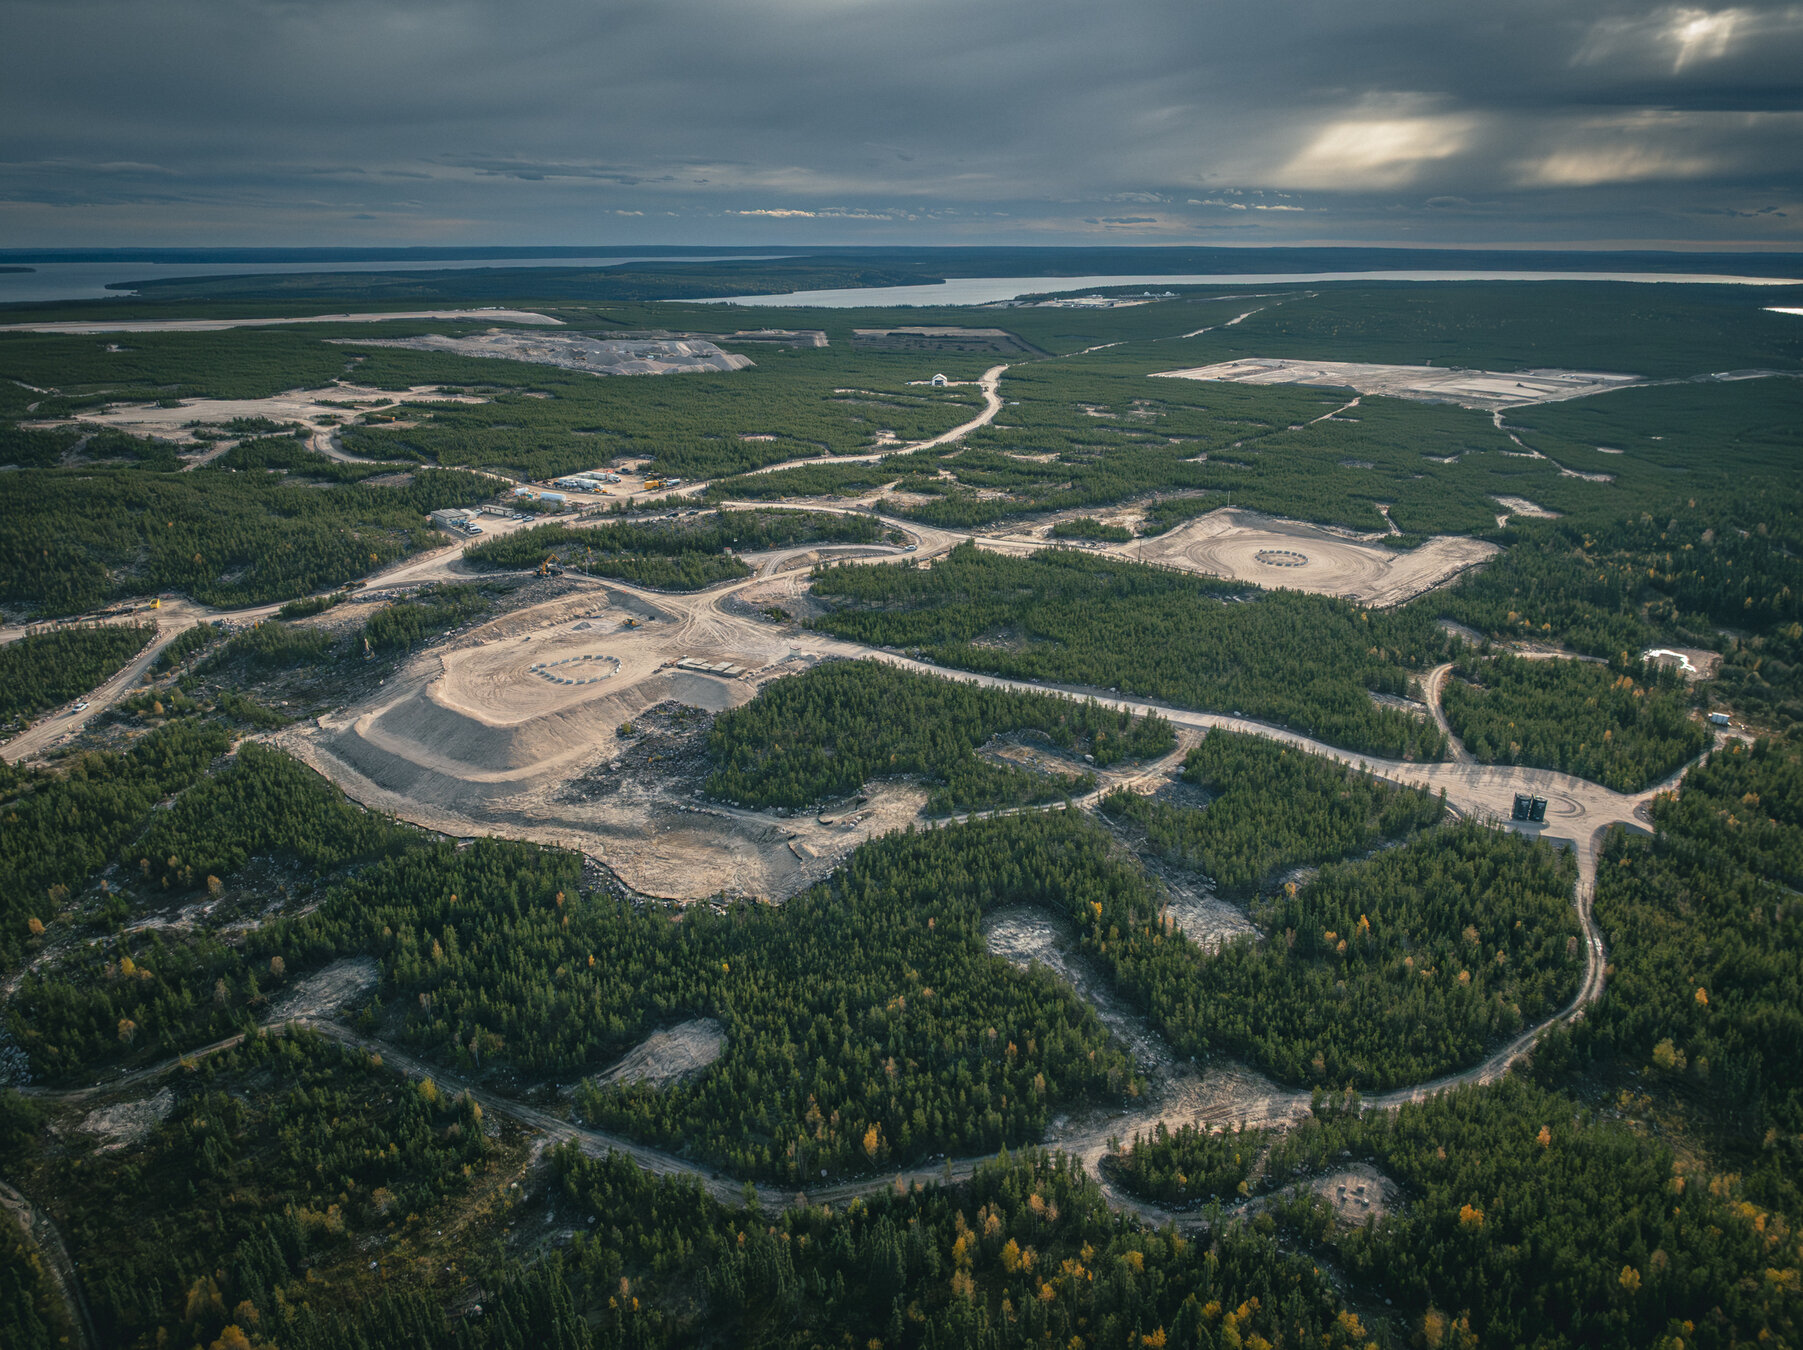
Rook I progress on the ground – Q3 2026.
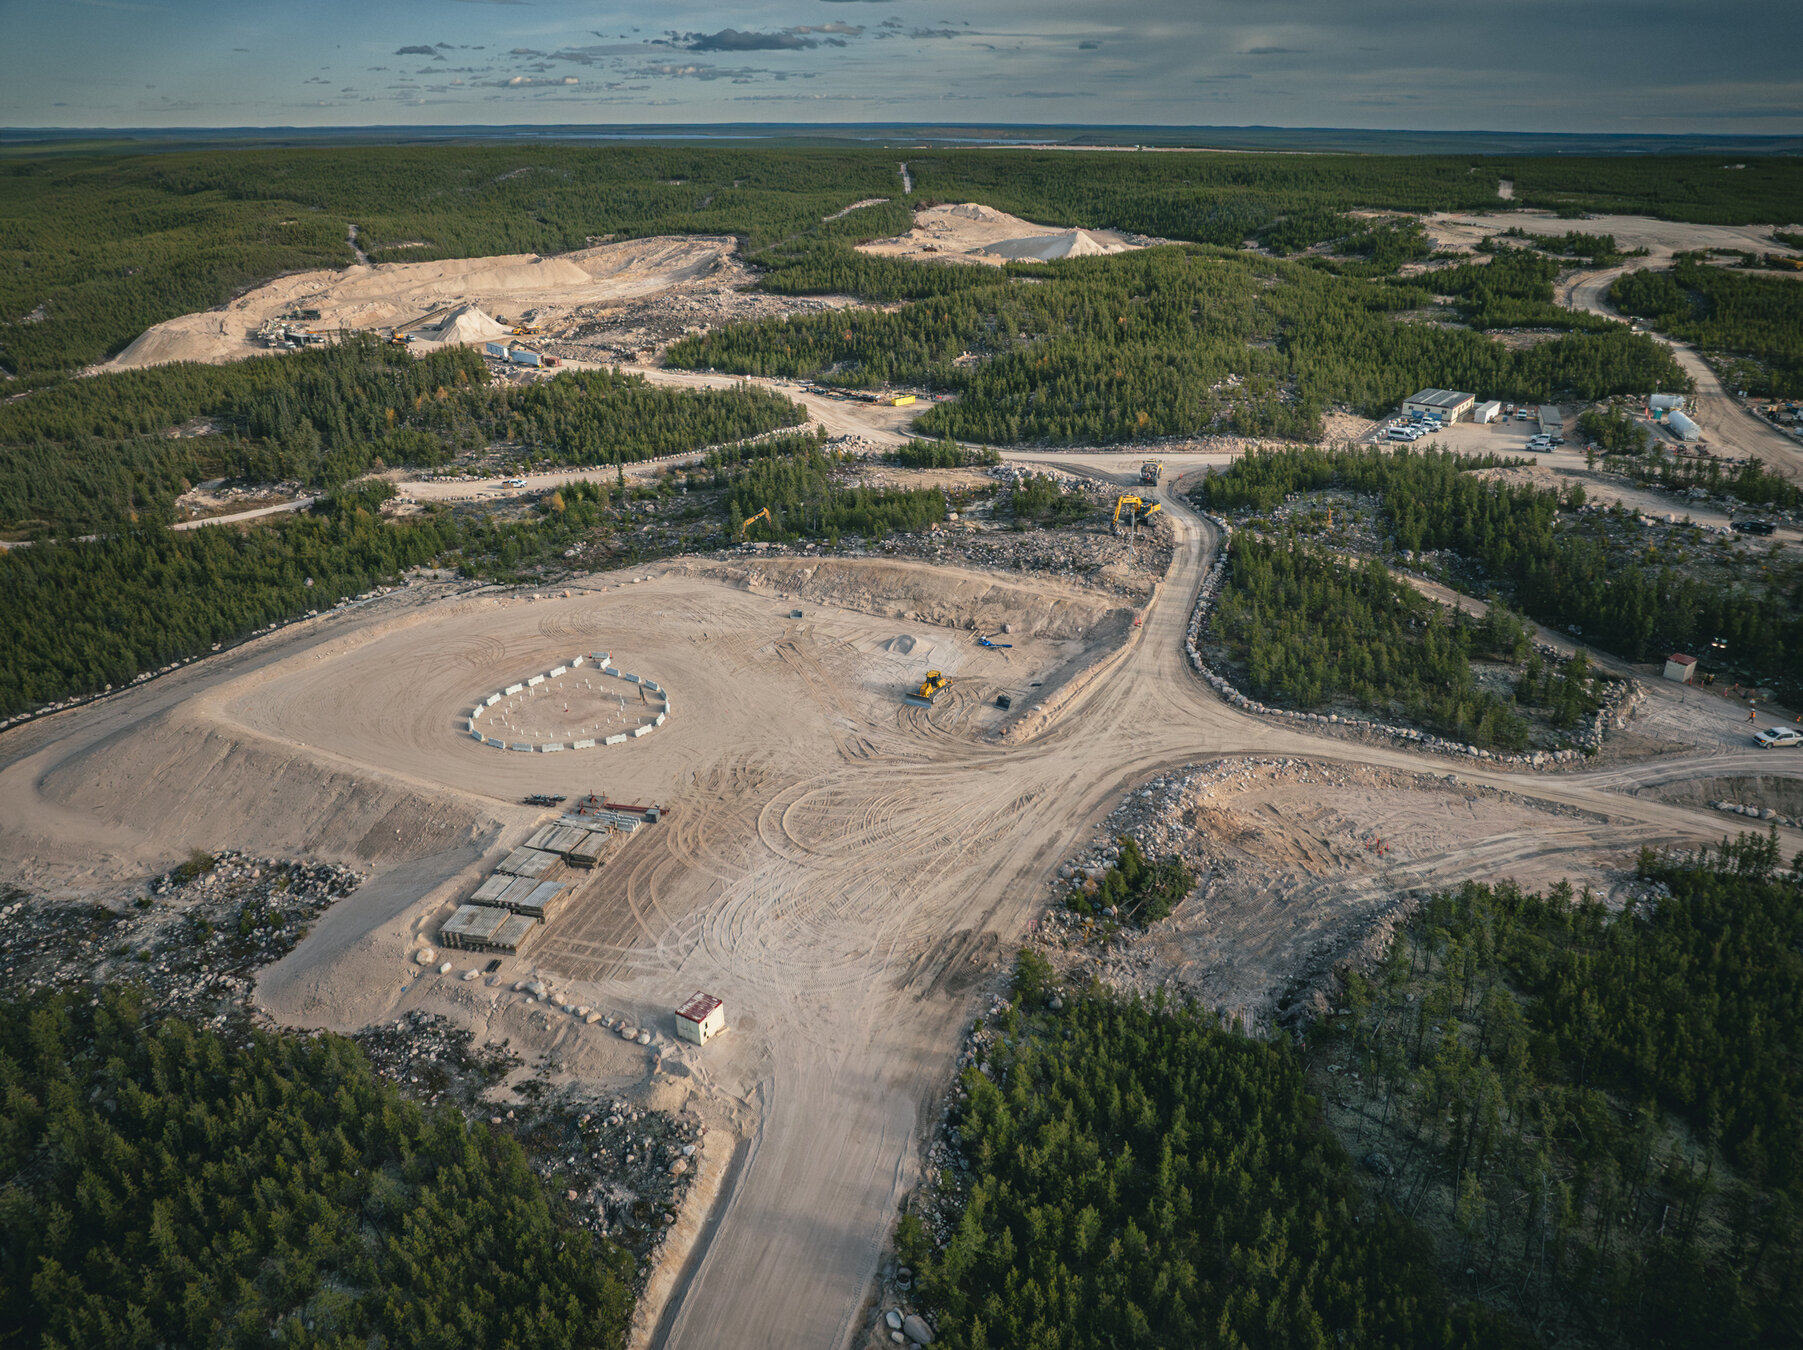
Aggregate crushing & stockpile area
Exhaust Shaft Construction
Core Shack Expansion
Construction facilities pad
Diffuser Installation Complete
Airstrip Expansion to 5,840 feet in progress
NEXGEN | THE ASSET: ROOK I
17
NEXGEN | THE CLOCK PROBLEM
Low material movement. High-value output.
High-grade ore enables just 3 trucks per day to feed the mill* - compared to hundreds or thousands at typical mining operations. And just 2 trucks leaving site - dramatically reducing infrastructure and environmental impact.
Low footprint. Low cost. Extraordinarily high value.
3
TRUCKS*
Ore is mined, brought to surface through the shaft and trucked to the mill
1,300
TONNES
Of ore processed through the mill
=
63
TONNES
Refined U3O8
157
BARRELS
Of U3O8 produced

2
TRUCKS
Barrels shipped from site
DAILY INPUT
DAILY OUTPUT
NEXGEN | THE ASSET: ROOK I
*Based on maximum licensed capacity and 450 tonne trucks


18
The Investment Case
19
Leveraged to rising uranium prices.
NEXGEN | THE INVESTMENT CASE: CONTRACTING STRATEGY
Uranium Price (US$/lbs.U3O8) | 2030 | 2031 | 2032 | 2033 | 2034 |
$80 | $79 | $79 | $79 | $79 | $79 |
$100 | $99 | $99 | $99 | $99 | $99 |
$150 | $141 | $141 | $141 | $141 | $141 |
$175 | $150 | $150 | $150 | $150 | $150 |
Realized Weighted Volume Average Price For The First 3 Sales Commitments*
Realized Table (Excludes Escalation):
Table based on initial sales commitments totaling 1 Mlbs U3O8 per annum over 5 years
*Rounded to the nearest dollar, includes any applicable discounts, excludes ancillary commissions, and associated costs of delivery. It is intended for illustrative pricing outcomes under 5 million pounds of committed volumes, based on various assumed spot price scenarios. These outcomes exclude the Company’s market-related pricing structure. Table does not include the August 2025 contract of an additional 5 million pounds. Refer to the December 4, 2024 Press Release for more information.
Total sales commitments for 11.7 million lbs at market-related pricing, scheduled from commercial production.
1 Statements regarding future cash flows, production, sales, uranium price, and operating costs of the Rook I Project are subject to the various risks and assumptions as outlined in the Company’s AIF, and those further described under the heading “Forward Looking Information” of this Presentation.
2 Refer to August 6, 2025 Press Release for more information.
- NexGen’s contracting strategy is designed to capture rising prices:
- Volume-based contracts
- Market-related price mechanisms at the time of delivery
- Structure provides optimum leverage to future uranium prices
- Low OPEX provides protection in any pricing cycle
Applying a simple strategy which reflects the geological hard rock setting of Arrow:
- Maximize profitability (price) per lb sold by aligning sales with market demand.
Built by design.
20
Path to becoming a top 10 global mining company.
NexGen: 1 Asset · 1 Region — Avg Annual After-Tax FCF (Y1 -5) (US$M)
414
573
811
888
1,046
1,205
1,368
1,530
$30
$40
$50
$60
$70
$80
$90
$100
U3O8 Price (US$/b)
Mining Companies Ranked by 2025A FCF (Excl. Precious Metals and Steel Companies)¹
Rank
Company Name
2025A FCF (US$M)
# of Assets (#)
# of Regions (#)
Market Cap. (US$B)
Enterprise Value (US$B)
1
BHP Group
$10,184
57
9
$209.1
$228.6
2
Rio Tinto
$4,497
51
10
$163.1
$214.6
3
Glencore
$5,138
109
18
$80.0
$115.5
4
Fortescue Metals
$3,120
12
3
$40.8
$41.8
5
Vale
$4,785
57
6
$66.7
$78.7
6
Southern Copper
$3,382
34
4
$145.3
$146.7
7
Anglo American
$2,189
25
9
$57.8
$70.6
8
Freeport-McMoRan
$1,116
23
6
$90.4
$109.2
9
Lundin Mining
$658
8
3
$20.8
$22.2
10
First Quantum
$512
14
7
$22.7
$29.5
1 FactSet, CapIQ. Peer FCF represents 2025A Operating Cash Flow less CAPEX (calendarized) as reported by FactSet; screen excludes precious metals and steel producers and companies solely listed on the Moscow Exchange. Active mining properties and jurisdictions from CapIQ. Peer market capitalization and enterprise value (as reported by FactSet) are as of June 30,2026; currency figures presented in US$ with conversions at FactSet spot rates as of that date. NexGen basis: NexGen’s projected after-tax FCF figures are non-GAAP measures and are derived from the 2021 Feasibility Study base case (US$50/lb U3O8), with sensitivity prices shown based on the August 2024 Interim Trend Update. Comparability and assumptions: Peer figures may not be directly comparable due to differences in definitions, accounting policies, tax regimes, sustaining vs. growth capital treatment, and timing; NexGen’s after-tax FCF should not be considered in isolation or as a substitute for IFRS measures. Sensitivities are illustrative only and do not represent forecasts of uranium prices or prices at which uranium produced from the Rook I Project can be sold. Forward-looking information and risks: This slide contains forward-looking information subject to risks and uncertainties – including uranium price and FX assumptions, permitting and regulatory approvals, construction execution, financing availability and terms, supply chain and inflationary pressures, and broader market conditions. Actual results may differ materially; see “Forward-Looking Statements” in this presentation. Prospective investors should avoid undue reliance on sensitivity analyses or forward-looking information; NXE Market cap as of June 30, 2026.
NEXGEN | THE INVESTMENT CASE: TOP 10
21
Path to Free Cash
STATUS AS AT OCTOBER 2026
Early-stage construction
Rook I’s C$100m site program is complete, on
time, on budget and within scope. Site earthworks, shaft-pad preparation and freeze-plant foundations are underway through H2 2026.
Federal approval
Received (final)
Current phase
Site prep & shaft-pad works
First ore targeted
Q3 2030
Stage complete
Stage ahead
NexGen today
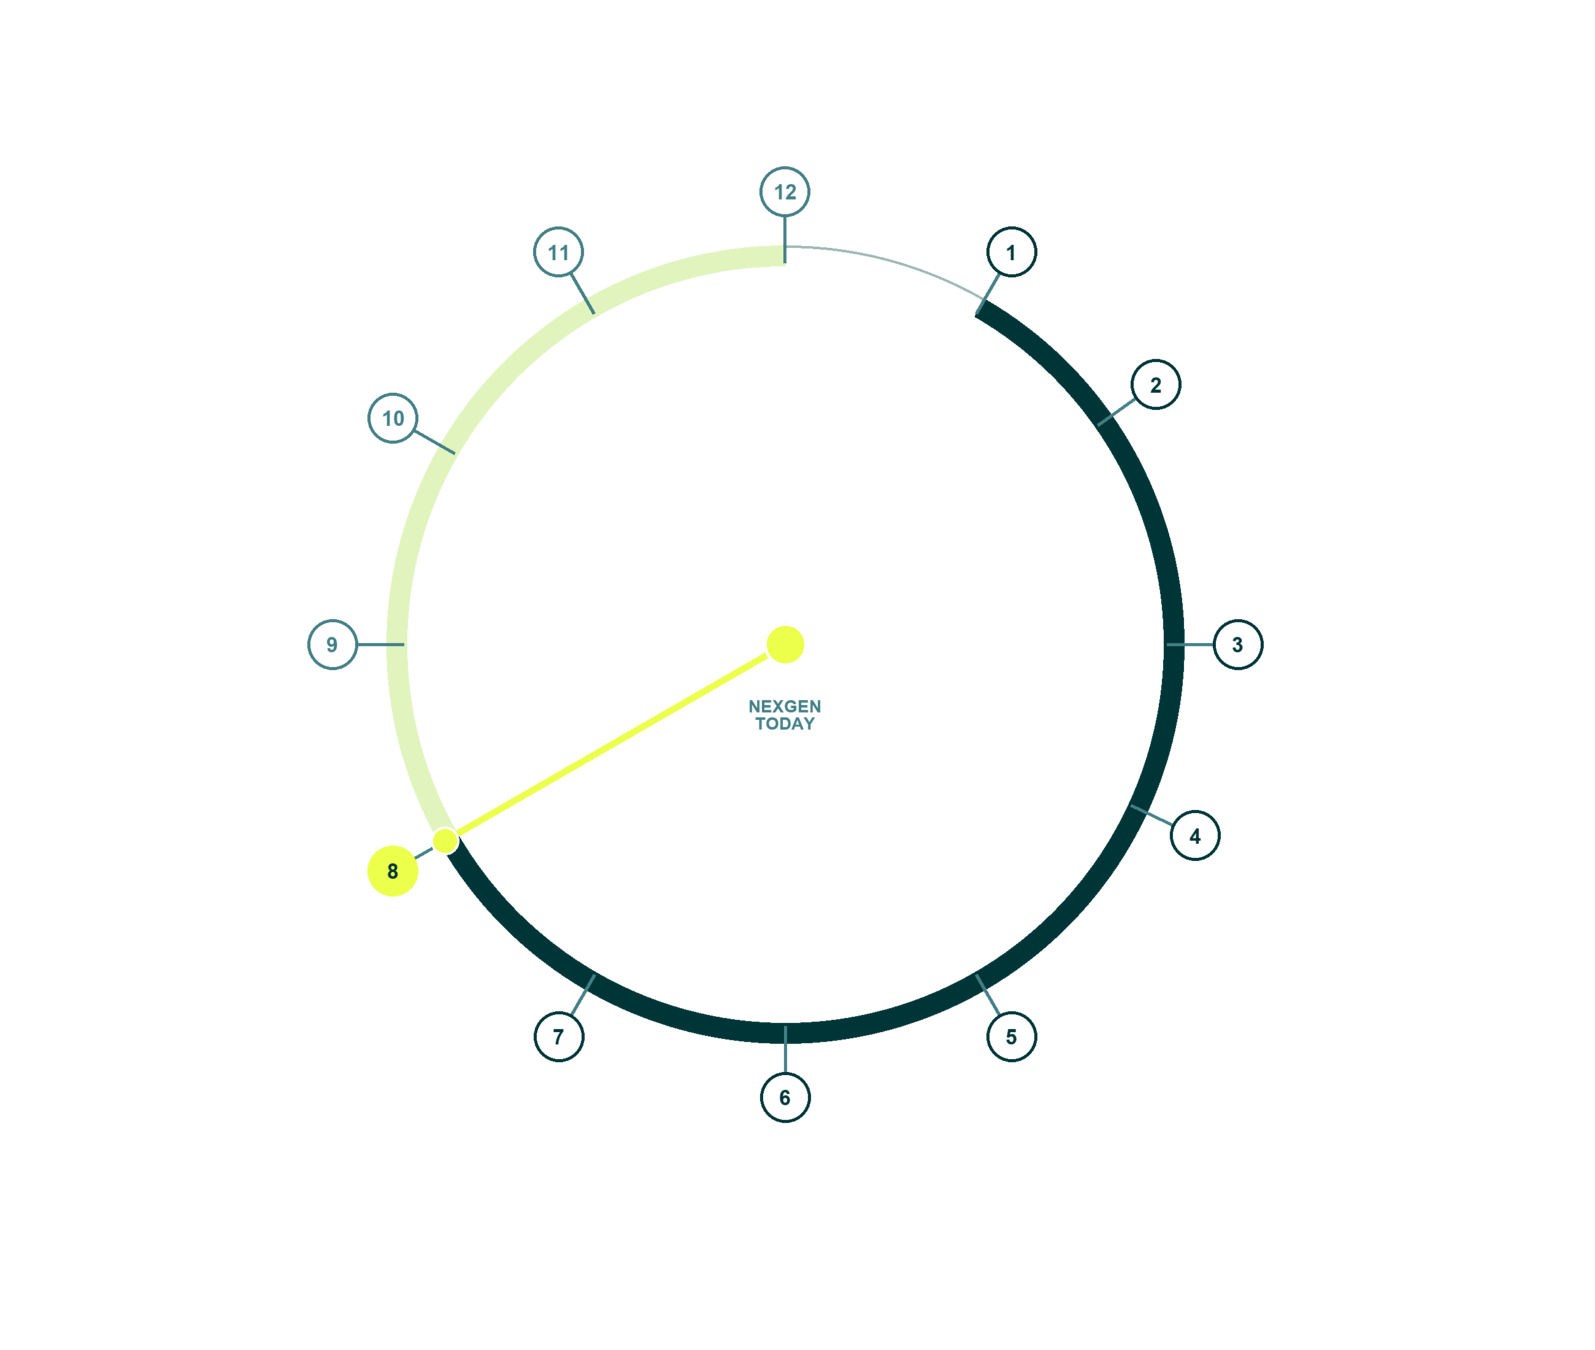
Discovery
Resource
Definition
Scoping /PFS
Permitting
PCE Discovery
Permitting
Permitted
Construction
Commissioning
Ramp-up
Production
Free cash machine
for generations
NEXGEN | PROJECT LIFECYCLE CLOCK
22
This is what 30 million pounds of uranium looks like in the real world.


Fueling enough carbon-free energy to power up to 46 million homes annually. Approximately 1 in 3 homes across the entire United States.
Removing the equivalent of 70 million cars from the road every single year.
Displacing more than 300 million tonnes of CO2 annually. Not offset. Displaced.
NEXGEN | THE INVESTMENT CASE: IMPACT
*Annual impact metrics (e.g., cars off the road, CO₂ displaced, homes powered) are calculated based on the Rook I Feasibility Study production schedule – approximately 30 million lbs U₃O₈ per year, Years 1–5, as outlined in the 2021 FS. These figures are illustrative only, do not imply any increase to reserves or extension of mine life, are subject to permitting, financing, operating performance, and market conditions, and do not include construction-phase impacts.
Our Impact.
23
The communities closest to Rook I aren't just supportive.
They're invested.
THIS IS WHAT GOOD ENERGY LOOKS LIKE LIKE ON THE GROUND.
- Chief Teddy Clark, CRDN
“Since as early as 2013, the Rook I Project has been a platform for both NexGen and the CRDN, together with regulatory authorities, to set a new and elite standard on Indigenous engagement, participation, and partnerships for projects in the traditional territory of Indigenous peoples.”
“The Rook I Project is bringing once-in-a-lifetime opportunities and change to our Citizens in NRII. NexGen has shown leadership in the industry, by working with us, and recognizing our voice, and our people … We applaud NexGen for its leadership, and its respectful, and collaborative approach, and we look forward to the development of the Rook I Project.”
- Leonard Montgrand, MN-S Regional Director for NRII
NEXGEN | THE INVESTMENT CASE: IMPACT
Industry-leading Benefit Agreements signed with all four identified Local Priority Area Indigenous communities reflecting tremendous advocacy for the Project:
- ✓Clearwater River Dene Nation
- ✓Birch Narrows Dene Nation
- ✓ Buffalo River Dene Nation
- ✓Métis Nation – Saskatchewan Northern Region II, in partnership with the Métis Nation – Saskatchewan
Indigenous-led partnership:
NexGen partnered with Clearwater River Dene Nation and Métis Nation to develop a 59-room hotel in La Loche, creating 36 local jobs and supporting Rook I, with full community ownership at completion.
24
Investing in people.
Competitive Advantage
1 NexGen 2024 Sustainability Report
NEXGEN | THE INVESTMENT CASE: IMPACT
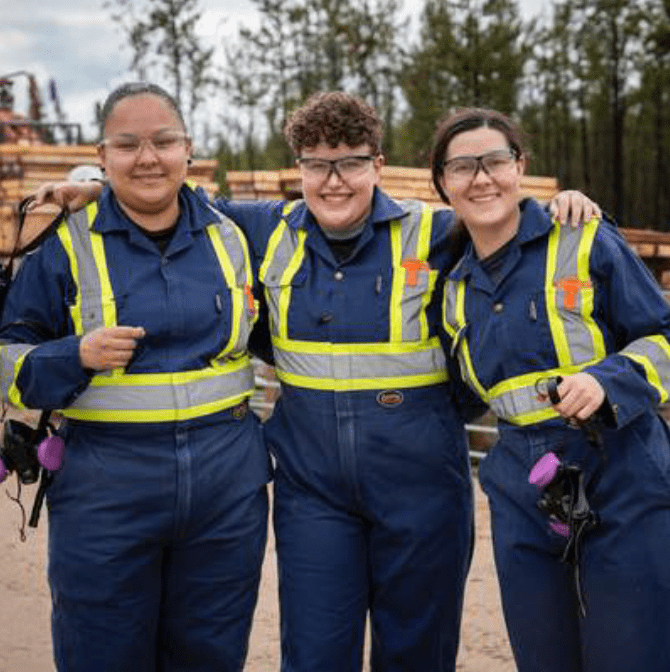
500+
Local Priority Area (LPA) students have participated in Company-funded skills, certification, and professional development programs since 2023.
82%
Of NexGen's Rook I site employees in 2024 were from the LPA in northern Saskatchewan.
Located 150 km north of La Loche and Clearwater River Dene Nation (combined population 4,500+), the Rook I Project is integrating local talent by creating training programs, hiring locally and developing skillsets that extend beyond mining¹.
94% of Rook I procurement spend in 2024 went to local suppliers and Indigenous partnered businesses — totaling C$56.6 million.
Rook I Procurement Spend in 2024
6% Other Suppliers
94%
Local Priority Area Suppliers
Educational Partners in Saskatchewan:





25
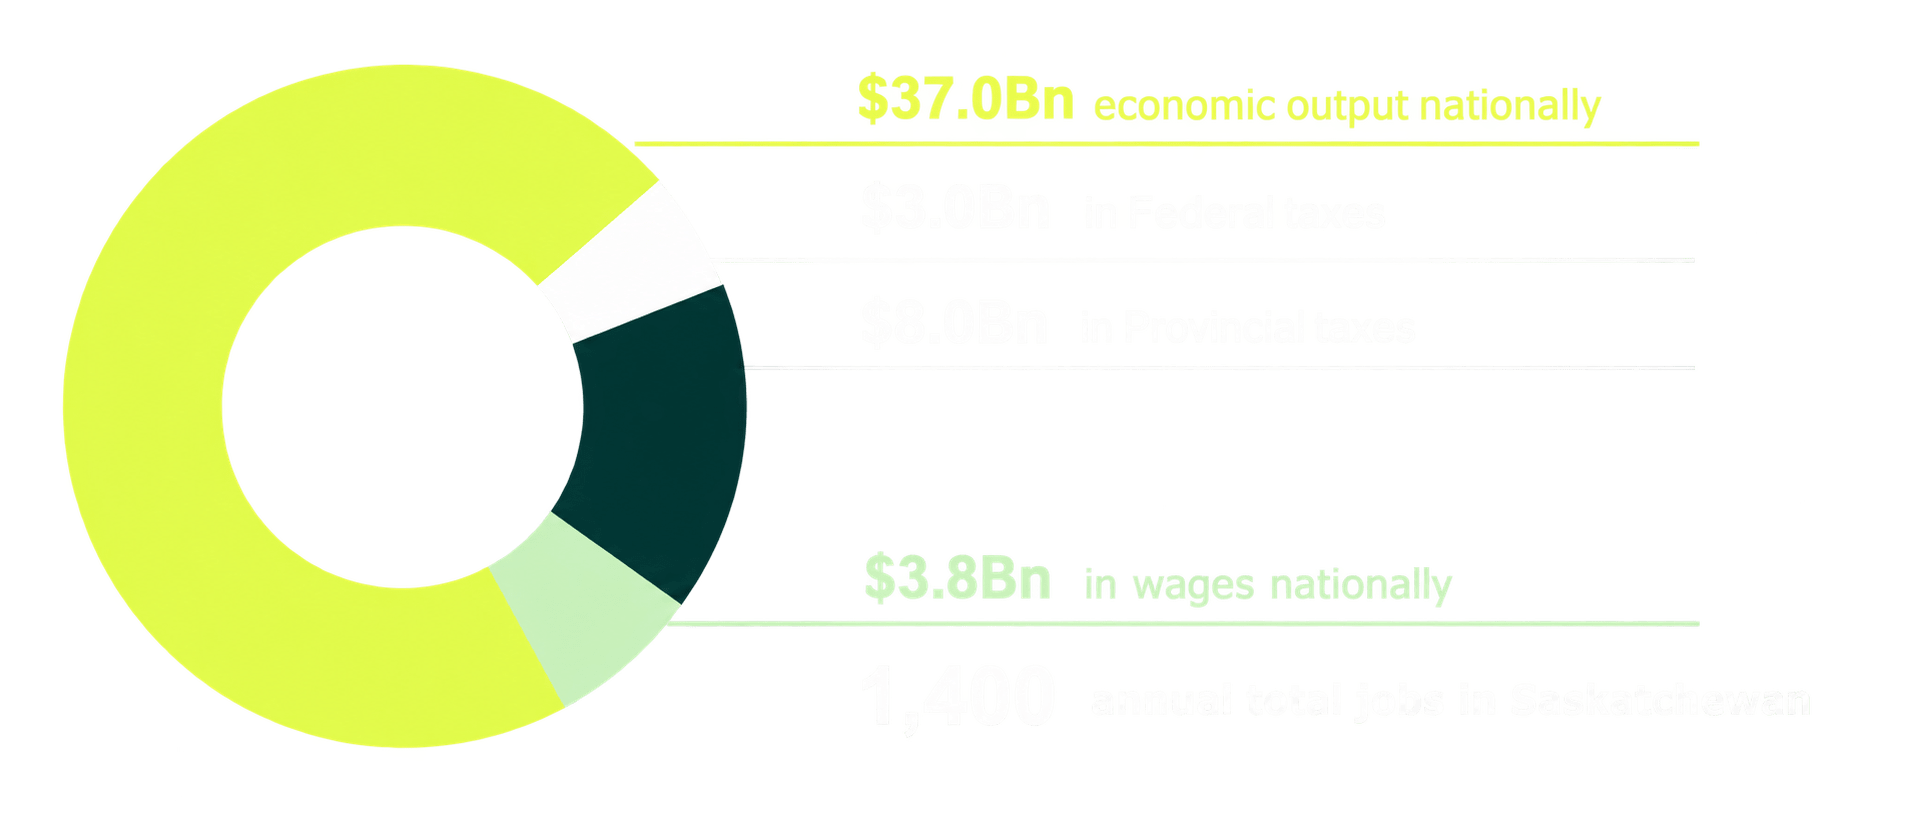
$37 Billion economic engine for Canada.
A Nation Building Project.
1 EY’s 2025 Economic Impact Study for NexGen – Rook I Project.
NEXGEN | THE INVESTMENT CASE: IMPACT
Total Economic Impact1
Over Construction and the First 11 Years of Production (figures in C$)
- ✓Supporting families, Indigenous employment, and local communities.
- ✓ Fuels public infrastructure, services, and growth.
- ✓A generational opportunity for Canadian economic and clean energy leadership.
26
The Optionality
27
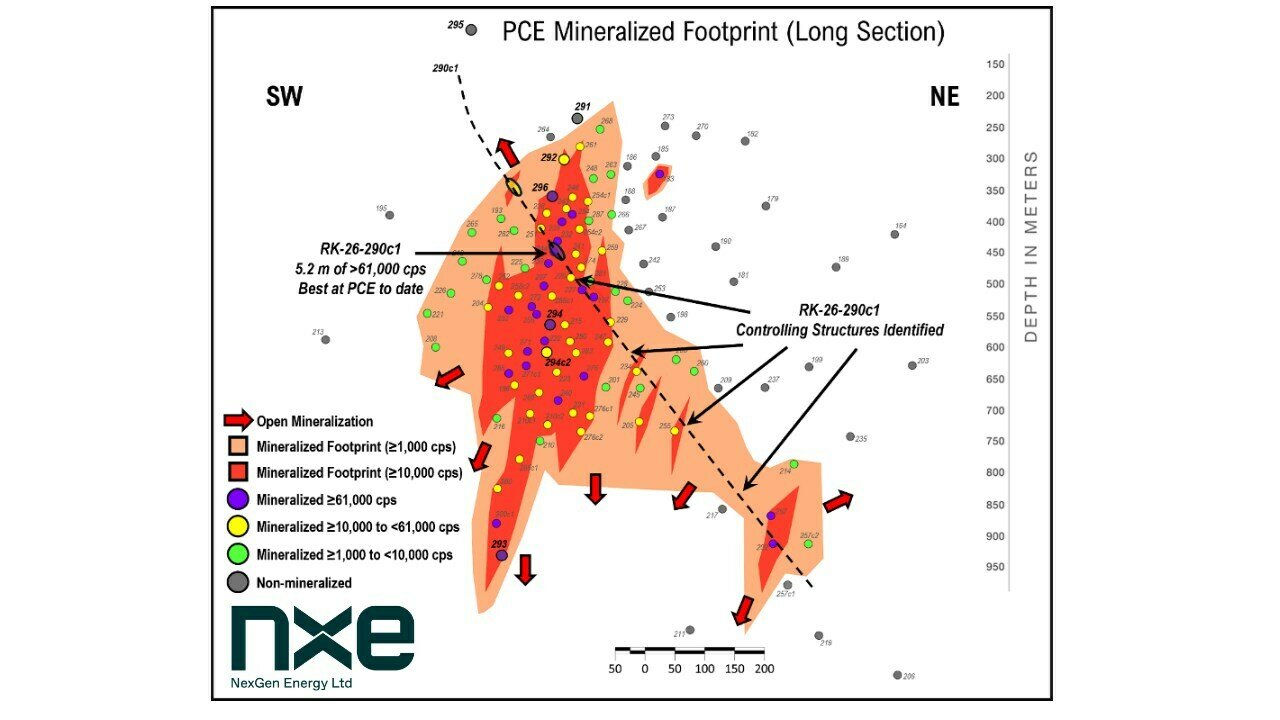
Patterson Corridor East (PCE) Evolving High-Grade Discovery, 3.5 km East of Arrow
Multiple High-Grade Uranium Intercepts Confirm Expansion and Continuity of PCE
- PCE continues to exhibit extensive mineralization, with 79 of 115 holes mineralized, including 54 intersecting high-grade (>10,000 cps) and 21 off-scale hits (61,000 cps), indicating extremely high-grade uranium.
- High-grade subdomain vertical extent expanded 17% to 644 m, with uranium mineralization now extending to 930 m depth².
Recent high-grade intercepts include:
- RK-25-232 - 15.0 m @ 15.9% U₃O₈ including an exceptional 0.5 m section of @ 68.8% - best discovery- phase intercept to-date
- RK-25-239 – 13.0 m @ 5.2% U₃O₈, including 0.5 m @ 30.2%
- RK-25-240 – 10.0 m @ 3.95% U₃O₈, including 0.5 m @ 33.3%
- RK-25-244 - 17.0 m @ 7.63% U₃O₈, including 6.0 m @ 21.1%
- RK-25-256 - 5.5 m @ 21.4% U₃O₈, including 2.5 m @ 46.1% with 0.5 m @ 74.8%
2026 Program:
45,500 m exploration program underway (42,000 at PCE and 3,500 at SW3), with a fifth drill added to accelerate expansion and definition of the PCE high-grade subdomain.
Figure 1: Interpreted model of mineralization at PCE (as of this release); new holes emphasized by larger diameter pierce points and bold labels with the trace of down plunge test in dashed black; view is a long section that looks perpendicular to the primary mineralized plane; total mineralized footprint in orange and the high-grade subdomains in red¹
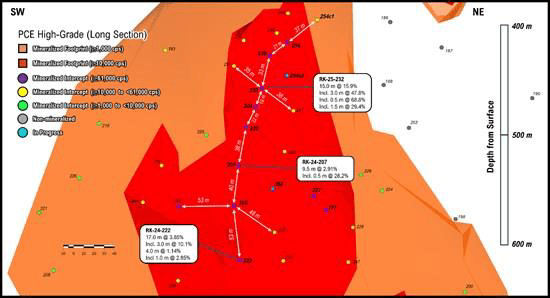
Figure 2: Close-up of long section view of PCE high-grade subdomain around RK- 25-232 (15.0 m at 15.9% U3O8).
1 Refer to the News Releases dated 25 August 2026, 7 May 2026, 22 April 2026, 15 Jan 2026, 29 July 2025, 27 May 2025 and 24 March 2025 and the Company’s MD&A dated August 5, 2025 for the periods ended June 30, 2025 and filed under the Company's profile on SEDAR+ at sedarplus.ca, on EDGAR at www.sec.gov, and on the ASX at www.asx.com.au for the detailed spectrometer and assay results and other drilling details. · 2 These results are preliminary in nature and do not have demonstrated economic viability. No economic analysis has been completed, and any future resource or reserve estimates will require further drilling and technical evaluation. Geological similarities to the Arrow deposit are provided for context only. Such similarities are not indicative of mineralization, grade, tonnage, continuity, or economic potential elsewhere within the project.
NEXGEN | THE OPTIONALITY: PCE
28
Cash Flow
Year 1
Year 2
Year 3
Year 4
Year 5
Year 6
Year 7
Year 8
Year 9
Year 10
Year +
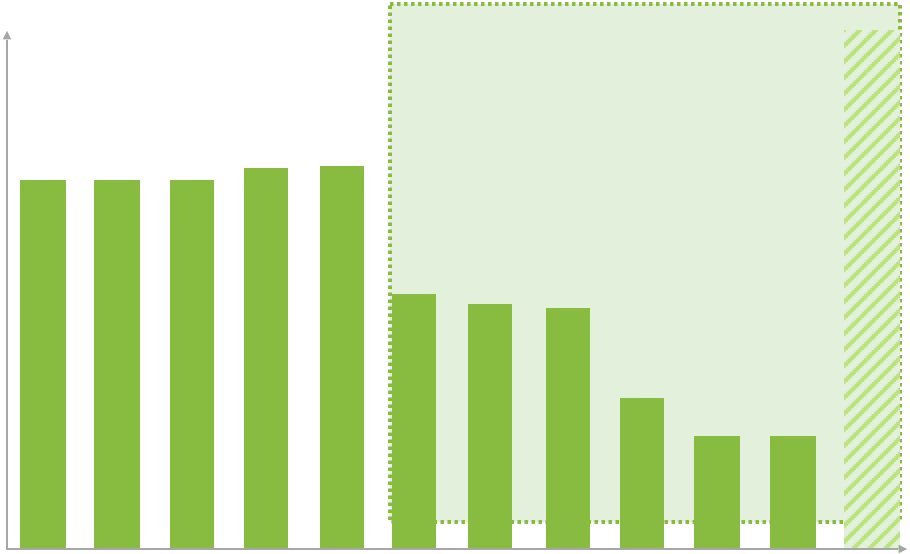

Inferred material not included in FS
Exploration Discoveries
Arrow deposit remains open along strike and depth
NexGen’s 190,000+ land package has the potential to become its own uranium-rich district – with Rook I as the foundation1.
Recent success at Patterson Corridor East has confirmed that high-grade uranium mineralization extends well beyond Arrow.
A DISTRICT IN THE MAKING. THE KIND THAT REWRITES THE SUPPLY MAP ENTIRELY.
150
exploration target areas across
27
key corridors
From project to district.
NEXGEN | THE OPTIONALITY: LAND PACKAGE
Rook I is set to deliver strong after-tax net cash flow for years2, with potential for resource expansion once in production3.
Future Expansion Potential:
1 Additional details regarding reserves and resources can be found in the Rook I FS. Mineral Resources are inclusive of Mineral Reserves. Mineral Resources that are not Mineral Reserves do not have demonstrated economic viability. 2 Statements regarding future cash flows, production, sales, uranium price, and operating costs of the Rook I Project are subject to the various risks and assumptions as outlined in the Company’s AIF, and those further described under the heading “Forward Looking Information” of this Presentation. 3 The current mine plan and economics remain those in the 2021 Feasibility Study |
29
IsoEnergy: Hidden Value in Plain Sight
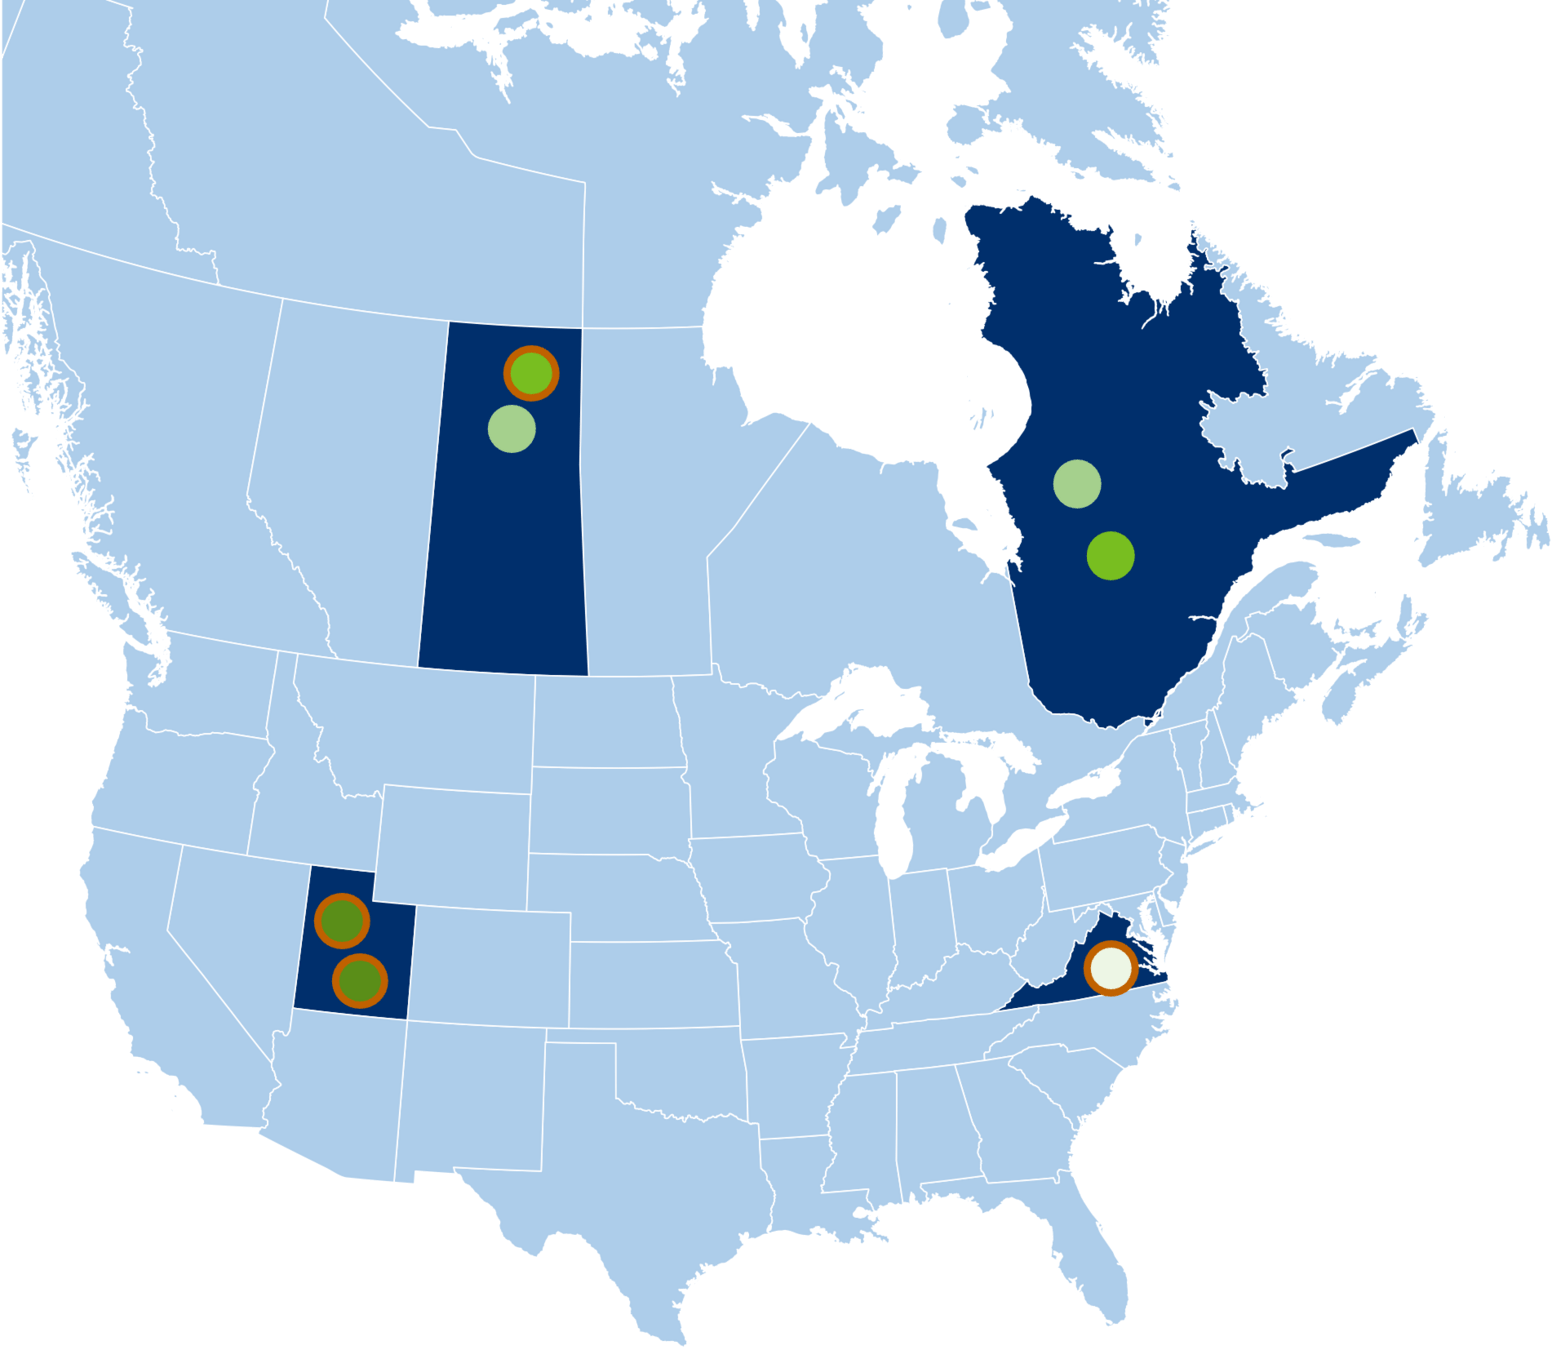
NexGen Energy holds ~28% of IsoEnergy , providing exposure to a diversified portfolio of high-quality uranium assets globally, including strategic, large and high-grade U.S. assets.
IsoEnergy has a balanced portfolio across near-term production, development, and strategic long-term optionality.
1 Coles Hill resource is a historical estimate under NI 43-101. A qualified person has not done sufficient work to classify the historical estimate as current, and NexGen is not treating it as a current mineral resource. IsoEnergy has disclosed that it would need to conduct further exploration, including twinning historical drill holes, to verify this as a current mineral resource.
NEXGEN | THE OPTIONALITY: ISOENERGY
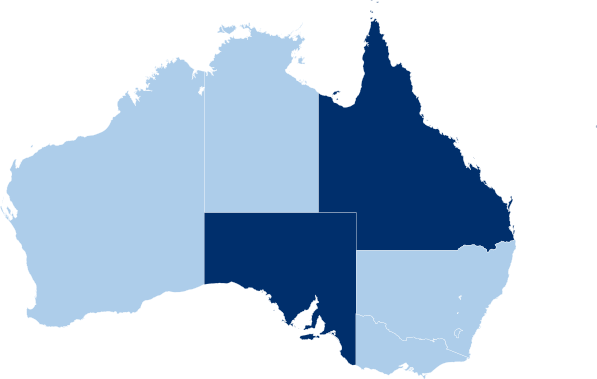
Australia
Queensland:
Milo
Ben Lomond
Ardmore
Teddy Mountain
South Australia:
Yarrana
United States / Canada Mines
Utah:
Tony M*
Daneros*
Rim
Virginia
Coles Hill*
Quebec
Dieter Lake
Matoush
Saskatchewan
Larocque East – Hurricane*

Near-Term
Production
Flagship IsoEnergy Uranium Assets
Development
Exploration
Upside
Map Key
*
30
The Team
31

Leigh Curyer
Chief Executive Officer, President & Director

Travis Mcpherson
Chief Commercial Officer
Ryan Podrasky, CPA
Chief Financial Officer


Monica Kras
VP, Corporate Development
Luke Moger
VP, Environment, Permitting, Licensing
NexGen’s executive and leadership team brings expertise across the entire mining cycle - including permitting, project financing, construction, and operations - backed by centuries of combined industry experience and ready to deliver.
NEXGEN | THE TEAM
Executive and leadership team.


Dylan Smart
VP, Regional Development
Jason Craven
VP, Exploration

Proven leadership.
32
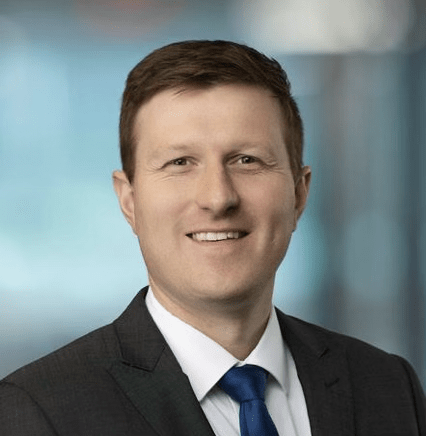
Bryan Dyck
Lead Processing & Metallurgy

Becky Douglas
Director, Procurement
25+ years’ experience leading procurement and supply chain for major projects.

Chris Komperdo
Area Manager
20+ years’ experience in underground mining, shaft sinking and early operations.
13+ years’ experience leading uranium processing and metallurgy programs.
Engineered for execution, NexGen’s Project Development team has successful execution experience across the full mining life cycle from early operational planning through to full-scale construction and long-term operations. Collectively, they have delivered globally significant projects, amassing over 2,122+ years of combined experience.
NEXGEN | THE TEAM
Project development team.
3,140+
Total Cumulative Years Experience
207
Combined Team Size
20+
Total Senior Leaders
2,122+
Cumulative Years Experience
127
Team Size
$20B+
Total $ Value Delivered
As of July 30, 2026
Operations and Project Development Team
Proven leadership.
30
33

Chris Copley
Project Director
20+ years’ experience delivering complex mining developments on time and on budget.

Don Merriman
VP, Engineering
30+ years’ experience leading large-scale EPC/EPCM engineering projects in mining.

Sheila Chernys
VP, Healthy, Safety, Environment and Radiation
20+ years’ experience health, safety, environment and regulatory leadership across mining and energy








The Board enhances NexGen’s deep expertise through a dozen subject matters, ranging from mining to capital markets, and regulatory and government affairs.
Chris McFadden
Chairman
Richard Patricio
Director
Brad Wall
Director
Karri Howlett
Director
Warren Gilman
Director
Ivan Mullany
Director
Sybil Veenman
Director
Sharon Birkett
Director
Proven leadership.
NEXGEN | THE TEAM
Board of directors.
34
Growth
35
Liquidity & Strategic Assets
C$970 M
Cash1
PROJECT FINANCING OPTIONALITY:
Prepayments, Strategic Partners, Project Debt and others
~30%
Iso Energy Ltd. Ownership (C$241M)2
2.7 Mlbs
of U3O8 Strategic Uranium Inventory
Shares Issued
677 M
Options
47 M
Fully Diluted4
~724 M
Q2/26 Average Daily Trading Volume5
C$153 M
Supports a fully funded path to production with supportive shareholder alignment.
OWNERSHIPS OF JUNE 30, 20266
1 Approximate cash balance as per June 30st 2026
2 Based on IsoEnergy market capitalization as of September 25, 2026
3 On May 8, 2024 the Company entered into a binding term sheet with MMCap International Inc. SPC for purchase of 2,702,410 lb of natural uranium concentrate for an aggregate purchase price of US$250M based on the 5-day average UxC spot price. This transaction closed on May 28th 2024.
4 Inclusion of the new US$110M 2023 Debentures and the US$250M 2024. Debentures, converted at US$6.76 and US$10.73, respectively, would bring the number to fully diluted shares to 757,427,218. Assumes potential conversion of the US$110M 2023 Debentures converted at US$6.76 (~16M), and of the US$250M 2024 Debentures converted at US$10.73 (~23M)
5 Traded on the TSX, NYSE and ASX for Q2 2026
6 Management ownership figures include shares held by Mega Uranium Ltd. For clarity, these shares are not owned or controlled by NexGen management or insiders, as per SEDI filings.
7 Rounded to the nearest percentage. Americas includes USA and Latin America, Australia includes Asia Pacific.
Retail
Institutional
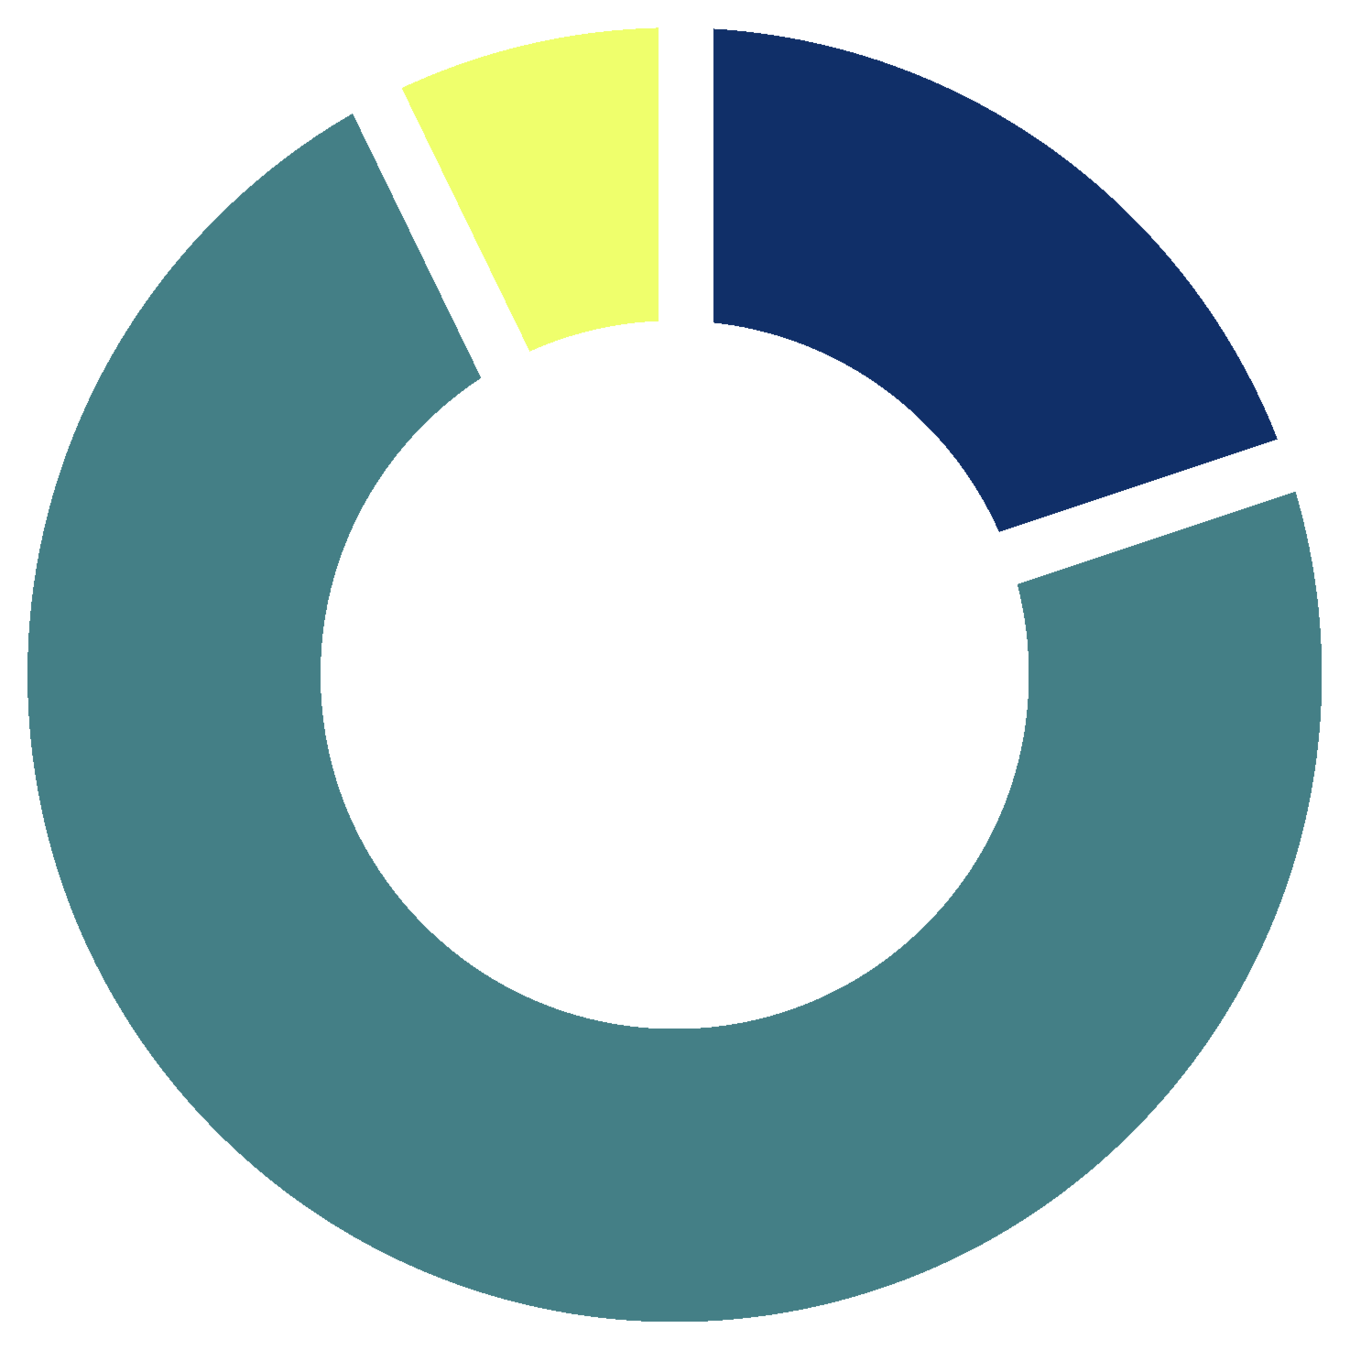
MANAGEMENT
5%
18%
RETAIL
INSTITUTIONAL
76%
NEXGEN | GROWTH : CAP TABLE
Positioned to fund, build and deliver
Share Structure







Analyst Coverage



36
OWNERSHIPS OF JUNE 30, 20266
Retail
Institutional
Management & Board

GROWTH
2026 Priorities.
Maintain Schedule and Budget
Finalize Optimal Financing
Advance Detailed Engineering and Critical Path Procurement
Continue Negotiations of Offtake Contracts
Continue Local Training Programs, Advance Hiring
PCE Exploration Drilling, Refining Extent of System
NEXGEN | GROWTH
37
NEXGEN | GROWTH
WHY INVEST NOW
Right People. Right Asset. Right Time.
A strategic natural resource project capable of re-establishing Canada as the largest uranium supplier globally.
The world’s most levered Company to uranium prices.
Carefully curated team to execute the project flawlessly.
Fully supported by all Indigenous partners.
Cash flow generation will re-rate company significantly.
Underinvestment in uranium supply for +15 years means a growing supply deficit and incentive prices rising.
38
We’re changing the world of nuclear energy , so nuclear energy can change the world.
39
Appendix
40
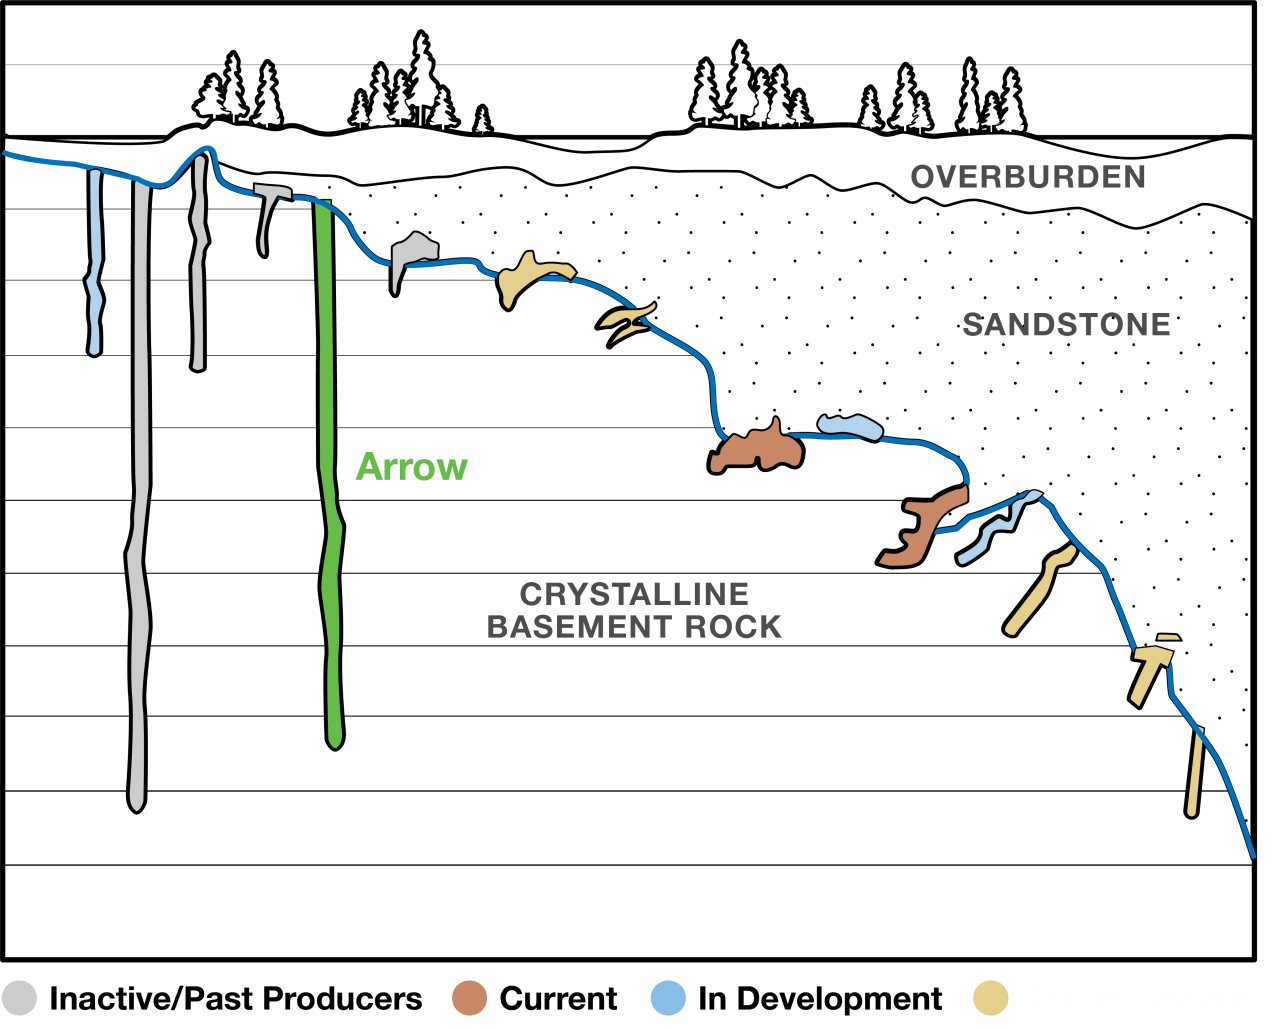
Favourable Geology Meets Mining Advantage.
Hosted underground in crystalline-granite rock with low hydraulic conductivity. Ideal conditions for conventional bulk mining methods.¹
Low water egress, monometallic, stable ground conditions, and nearly vertically stacked.
The high grades and favorable technical conditions drive low operating costs, creating a natural cost hedge and flexibility to structure contracts that will capture upside price potential.
Allows for flexibility of production volumes and provides consistent grades with predictable supply.
1 Rook I Feasibility Study, 2021
41
NEXGEN | APPENDIX
Inactive / Past Producers
Current
In Development
Known Deposit
NexGen mineral resources and reserves.¹
2021 FS Probable Mineral Reserves
Zone
Tonnage (k Tonnes)
Grade (% U3o8)
Contained Metal (Mlb U3o8)
A2
2,594
3.32
190.0
A3
1,982
1.13
49.5
Probable Reserves Total
4,575
2.37
239.6
2021 FS Mineral Resources
Classification
Zone
Tonnage (k Tonnes)
Grade (% U3o8)
Contained Metal (Mlb U3o8)
Measured
A2 LG
920
0.79
16.0
A2 HG
441
16.65
161.9
A3 LG
821
1.75
31.7
Measured Total
2,183
4.35
209.6
Indicated
A2 LG
700
0.79
12.2
A2 HG
56
9.92
12.3
A3 LG
815
1.26
22.7
Indicated Total
1,572
1.36
47.1
Measured & Indicated
A2 LG
1,620
0.79
28.1
A2 HG
497
15.9
174.2
A3 LG
1,637
1.51
54.4
Measured & Indicated Total
3,754
3.10
256.7
Inferred
A1 LG
1,557
0.69
23.7
A2 LG
863
0.61
11.5
A2 HG
3
10.95
0.6
A3 LG
1,207
1.12
29.8
A4 LG
769
0.89
15.0
Inferred Total
4,399
0.83
80.7
1 Rook I 2021 FS Technical Report as source. 1) Mineral Reserves are reported with an effective date of 21 January 2021. Mineral Reserves are estimated using a long-term metal price of US$50/lb U3O8. (2) Mineral Resources are inclusive of Mineral Reserves. Mineral Resources that are not Mineral Reserves do not have demonstrated economic viability.
NEXGEN | APPENDIX
42
Tailings Management: Industry-Leading Design
All processed waste streams will be stored underground, in backfilled mine stopes, or a purpose-built, innovative Underground Tailings Management Facility (UGTMF)¹.
The UGTMF will set a new global standard in environmental mine management.
1 For more detail on the mining and tailings method please refer to the Rook I FS.
Eliminates surface tailings disturbance and reclamation.
Near zero risk of surface tailings failures, mitigating one of the most significant risks in operating mining projects.
35
NEXGEN | APPENDIX: UGTMF
Rook I Project
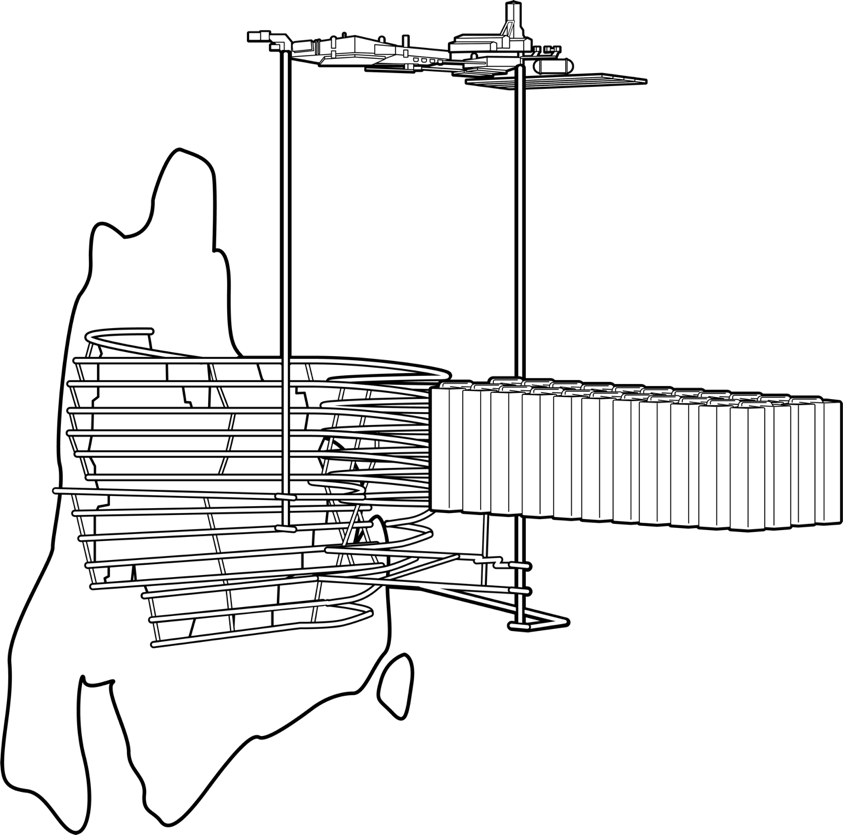
UGTMF
43
U.S Electricity Demand Outlook.
U.S. Electricity Demand Outlook (ICF)¹ — TWh
8,000
7,500
7,000
6,500
6,000
5,500
5,000
4,500
4,000
3,500
3,000
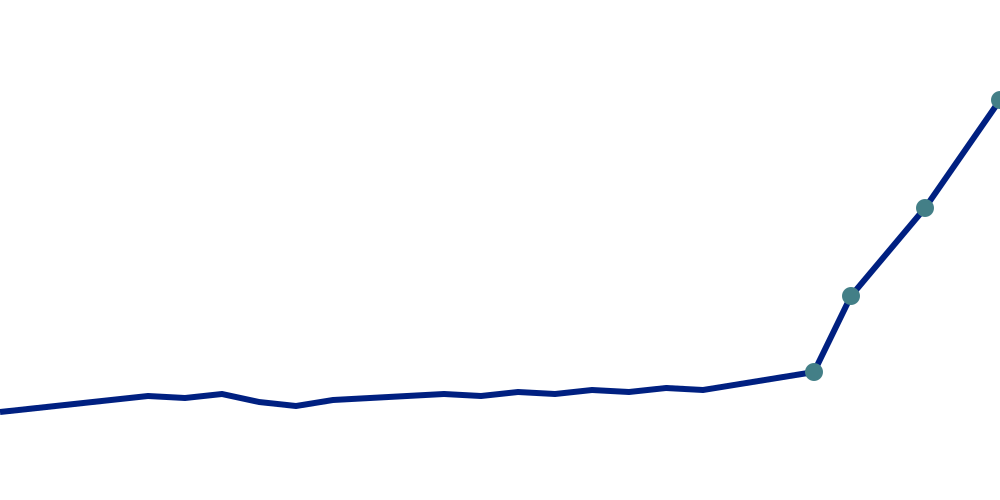
2001-24 0.7% CAGR
2024-30 3.3% CAGR
2024-50 2.1% CAGR
2001
2004
2007
2010
2013
2016
2019
2022
2024
2030E
2040E
2050E
Years 2001-2024
Years 2030-2050
1 EIA, ICF forecast, RBC Capital Markets
NEXGEN | APPENDIX: ELECTRICITY’S RESURGENCE
44
AI needs nuclear.
NEXGEN | APPENDIX
The electrification boom: tailwinds for nuclear power.
We are experiencing a seismic shift in energy consumption patterns. Energy providers are scrambling to revise demand forecasts to reflect the urgency of this escalating need.
Artificial Intelligence (AI) and Sector Electrification: The exponential rise of AI and the electrification of key sectors are catapulting electricity demands to unprecedented levels. This surge is particularly pronounced in AI, where data centers and computing infrastructure require significant resources.
Stable Energy Supply: The intermittent nature of renewable energy sources like solar and wind require a clean, reliable, baseload power source.
Low-Carbon Objectives: To meet global climate targets, the increased demand for energy will need to be supplied by low-carbon sources.
Unleashing the Potential of Advanced Nuclear Technologies: Smaller, more flexible nuclear reactor designs like small modular reactors (SMRs) are heralding a new era for nuclear energy.
Safety and Public Perception: Continued improvements in nuclear technology are needed to enhance safety standards, waste management, and public perception.
Estimated energy consumption per request for various ai-powered systems compared to a standard google search¹
10
9
8
7
6
5
4
3
2
1
0
Google search
ChatGPT
BLOOM
AI-powered Google search (New State Research)
AI-powered Google search (SemiAnalysis)
WH per request
1 The growing energy footprint of artificial intelligence by Alex de Vries
45
Clean Energy from Nuclear Power.
NUCLEAR POWER FOOTPRINT
Utilize only 10% to 34% of critical materials per GWh compared to solar, wind, and battery technologies, delivering potent low-carbon electricity with a minimal materials footprint.
Has an extractive impact that is 20x smaller than coal and gas per unit of electricity generated.
Mining intensity of clean electricity generation¹
AP1000
EPR
BWRX-300
Solar PV farm
LFP
Kg OF ROCK PER GWh GENERATION
CLEAN ELECTRICITY GENERATION SOURCE
1 Break Through Institute – Updated Mining Footprint and Raw Material Needs for Clean Energy. April 2024 AP1000 (Advanced Passive 1000), EPR (European Pressurized Reactor), BWRX-300 (Boiling Water Reactor, 300 MWe class), Solar PV farm (Solar Photovoltaic farm) and LFP (Lithium Iron Phosphate).
NEXGEN | APPENDIX
Nuclear advantage.
46
NEXGEN | APPENDIX: ELECTRICITY’S RESURGENCE
Efficient Use of Capital
NexGen’s ratio of exploration and development spend relative to its general and administrative spend is the highest compared to its uranium peers, while the Company’s ratio of general and administrative spend relative to its market capitalization is the lowest compared to its uranium peers.
General and Administrative Spend Per Dollar of Exploration and Development Spend ($CAD) (as of Dec. 31)⁽¹˒²⁾
$4.50
$4.00
$3.50
$3.00
$2.50
$2.00
$1.50
$1.00
$.50
$
$0.33
$4.25
2021
$0.29
$4.26
2022
$0.43
$3.31
2023
$0.37
$3.51
2024
$0.23
$2.62
2025
1. Exploration and Development spend includes costs related to exploration, drilling, environmental and permitting, engineering and design, direct labour and associated costs. Source: Publicly filed Annual Financial Statements and Management Information Circular of the management selected “Uranium Peers” for 2025, or projected if not available at the time of publishing this report, being Cameco Corp, Denison Mines Corp, Energy Fuels Inc, and Uranium Energy Corp. · 2. General and Administrative spend includes General or Administrative expenses as defined in each peer’s financial statements, or projected if not available at the time of publishing this report. Source: Publicly filed Annual Financial Statements and Management Information Circular of the management selected “Uranium Peers”, being Cameco Corp, Denison Mines Corp, Energy Fuels Inc, and Uranium Energy Corp. · 3. Market Capitalization sourced from S&P Capital IQSource: Publicly filed Annual Financial Statements and Management Information Circular of the management selected “Uranium Peers”, being Cameco Corp, Denison Mines Corp, Energy Fuels Inc, Fission Uranium Corp and Uranium Energy Corp.
47
Global Growth is Surging Across All Major Markets
NA
111 Operating
2 Planned
37 Proposed
0 Under Construction
Top Contributing Countries: USA · Canada
LATAM
7 Operating
0 Planned
4 Proposed
2 Under Construction
Top Contributing Countries: Argentina · Brazil · Mexico
EMEA
170 Operating
64 Planned
95 Proposed
22 Under Construction
Top Contributing Countries: Russia · Ukraine · UK
APAC
150 Operating
58 Planned
175 Proposed
56 Under Construction
Top Contributing Countries: China · India · Japan
Global Reactor count is rising led by APAC and EMEA, with North America re-entering growth mode
1 WNA July 2026 - Plans For New Reactors Worldwide. LATAM (Latin America), APAC (Asia-Pacific), EMEA (Europe, Middle East, and Africa) and NA (North America).
NEXGEN | APPENDIX
Nuclear reactors worldwide1
48
NEXGEN ENERGY LTD.
OCTOBER 2026
Vancouver Office
Suite 3150, 1021 West Hastings Street
Vancouver BC V6E 0C3
The World Needs Good Energy.
We’re Building it.
NXE_Corporate Deck_Oct
By share